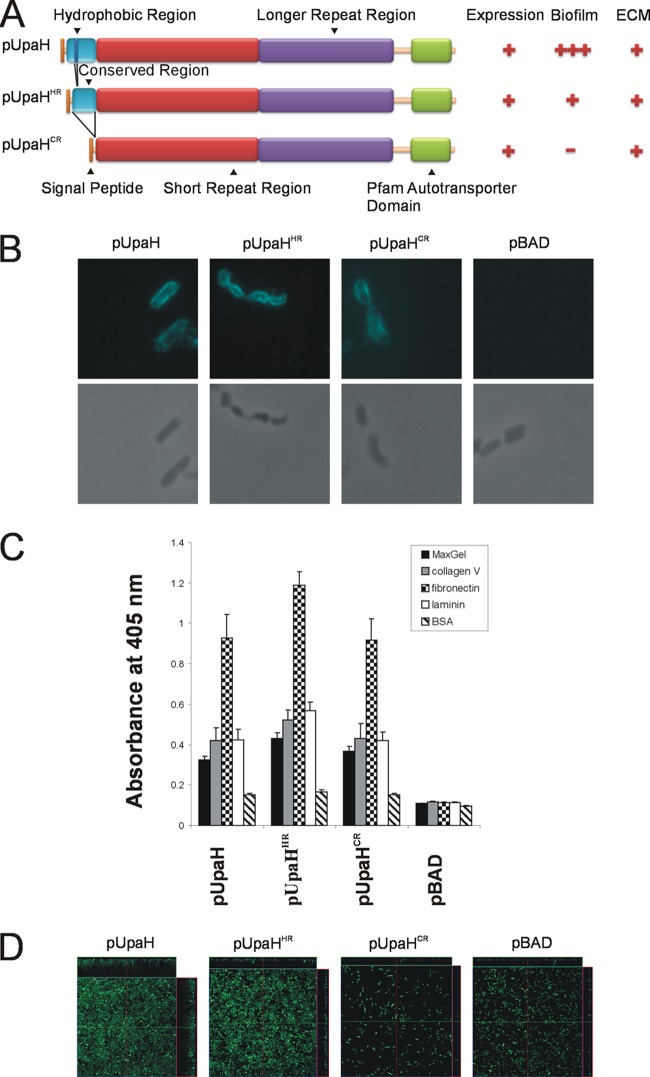
Fig 4.
(A) Schematic illustration of the domain organization of UpaH, UpaHHR, and UpaHCR and a summary of phenotypic results. Indicated are the signal peptide, the hydrophobic region, the conserved region, the small repeat region, the longer repeat region, and the transmembrane β-domain. (B) Immunofluorescence (top) or phase-contrast (bottom) microscopy employing UpaH-specific antiserum against the cells of the specified E. coli strains. Strains were grown in the presence of 0.2% arabinose. The overnight cultures were fixed and incubated with anti-UpaH serum followed by incubation with goat anti-rabbit IgG coupled to Alexa Fluor 350. Positive reactions indicating surface localization of UpaH, UpaHHR, and UpaHCR were detected. (C) UpaH, UpaHHR, and UpaHCR mediate E. coli binding to MaxGel, collagen V, fibronectin, and laminin in ELISA-based binding to the same levels. The bar charts represent average absorbance measurements at 405 nm of 3 independent experiments plus the SEM. The mean absorbance readings were compared with negative control readings from strain OS56(pBAD). (D) UpaH mutants deleted for the hydrophobic or conserved region that mediates different levels of biofilm formation in E. coli. Shown are the overhead views of biofilms formed under continuous flow by E. coli OS56 strains expressing pUpaHCFT073, pUpaHHR, pUpaHCR, or pBAD. Biofilm development was monitored via scanning confocal laser microscopy of the GFP-tagged E. coli strain OS56 cells. The images are representative horizontal sections collected within each biofilm and vertical sections (the right panel and above each larger panel, representing the yz plane and the xz plane, respectively). Under 24 h of continuous flow, the UpaH mutants affected biofilm growth with significant differences in level of biovolume (P = 0.001), substratum coverage (P = 0.003), vertical spreading (P = 0.001), mean thickness (P = 0.002), and biofilm roughness (P = 0.001). Measurements were analyzed using COMSTAT and the Kruskal-Wallis test. These results demonstrate that expression of pUpaHCFT073, pUpaHHR, and pUpaHCR resulted in different levels of biofilm formation when expressed from the same plasmid and in the same host background.

