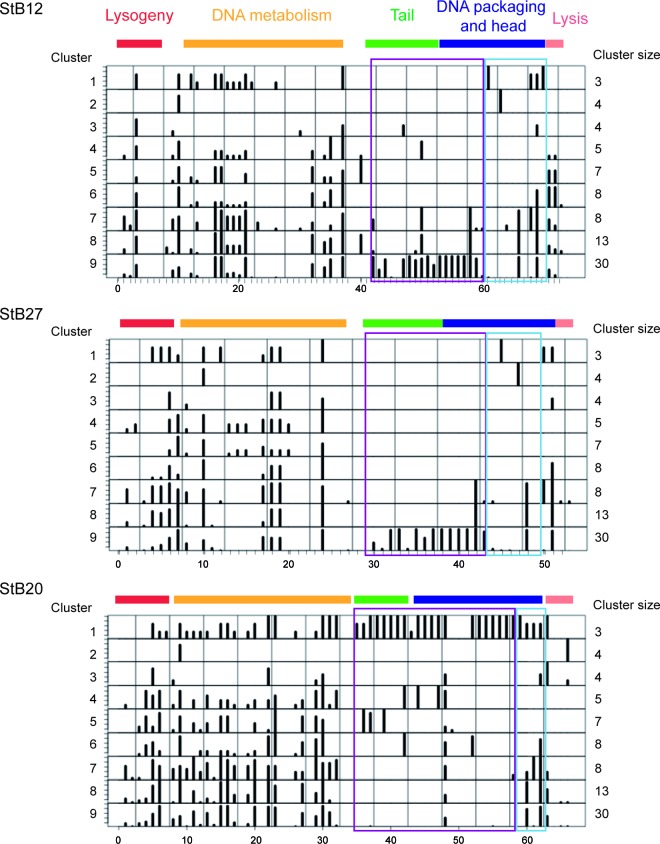
Fig 7.
Modular evolution of StB12, StB27, and StB20. The schematic representations of the genomes of StB12, StB27, and StB20 show the frequencies of homologs detected among the 9 clusters of phages. Functional modules are represented in different colors: red, lysogeny; yellow, DNA metabolism; green, DNA packaging and head; blue, tail; light pink, lysis. Purple boxes, structural components considered specific to a cluster; light-blue boxes, non-cluster-specific structural components.

