Fig 2.
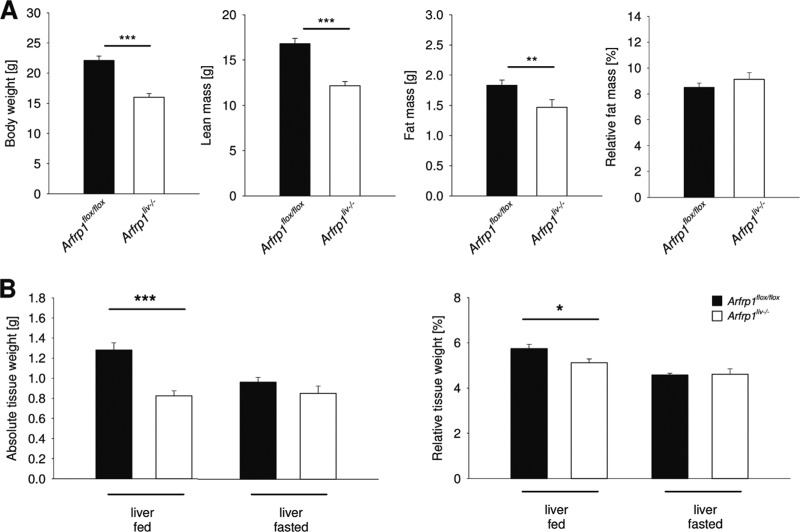
Growth retardation of liver-specific Arfrp1liv−/− mice. (A) Body weight of Arfrp1liv−/− and control mice. Absolute lean mass and fat mass of Arfrp1liv−/− and control mice were detected by nuclear magnetic resonance spectroscopy. The relative fat masses of Arfrp1liv−/− and control mice are shown in the right panel. (B) Absolute and relative liver weights in fed (left panel) and fasted (right panel) Arfrp1liv−/− and control mice. *P < 0.05; **P < 0.01; ***P < 0.001.

