Fig 6.
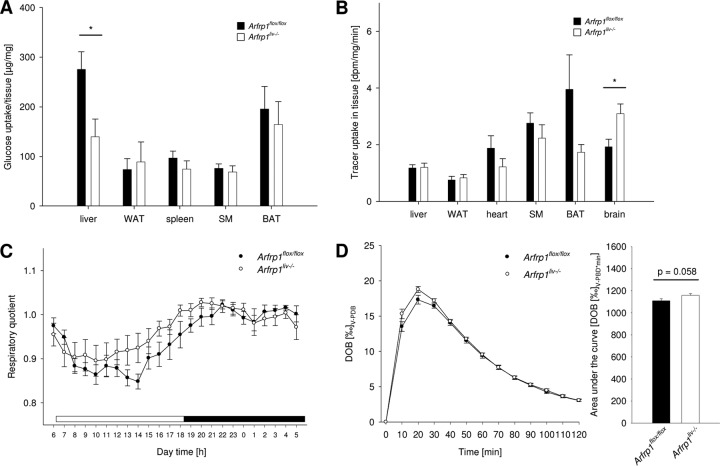
Altered peripheral glucose metabolism of Arfrp1liv−/− mice. (A) Reduced glucose uptake into livers of Arfrp1liv−/− mice after an oral application of glucose traced with [14C]deoxyglucose. BAT, brown adipose tissue; SM, skeletal muscle; WAT, white adipose tissue. (B) Basal uptake of [14C]deoxyglucose in the indicated tissues. dpm, decays per minute. (C) Respiratory quotient of Arfrp1liv−/− and control mice. The white bar indicates the light phase; the black bar indicates the dark phase. n = 5 to 9. (D) Glucose oxidation in Arfrp1liv−/− and control mice. *, P < 0.05. DOB, delta over baseline; V-PDB, Vienna PeeDee belemnite limestone carbonate.

