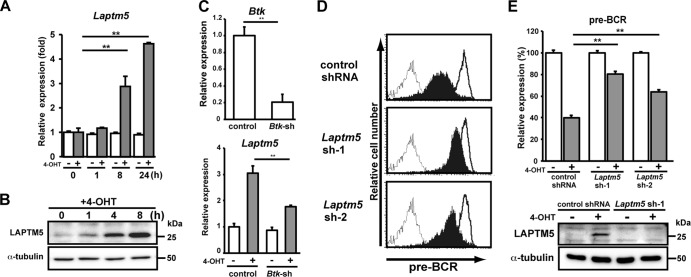
Fig 2.
BLNK-induced LAPTM5 expression is crucial for pre-BCR downmodulation. (A) BKO/BASH-ERtm cells were cultured with 4-OHT (filled bars) or control ethanol (open bars) for the indicated time periods and subjected to RT-PCR analysis. The relative expression level of Laptm5 mRNA at each time point is shown (means ± standard errors of the means; n = 3 each) (∗∗, P < 0.01), in that the level of Laptm5 mRNA expression in untreated cells is set as 1. (B) Immunoblot analysis of LAPTM5 and α-tubulin proteins in BKO/BASH-ERtm cells that were cultured with 4-OHT for the indicated time periods. (C, top) BKO/BASH-ERtm cells were infected with an hCD8-expressing retroviral vector carrying Btk shRNA or an irrelevant control shRNA, and hCD8+ cells were subjected to RT-PCR analysis for the expression of Btk (top). The level of Btk expression in cells infected with control shRNA is set as 1 (means ± standard errors of the means; n = 3 each) (∗∗, P < 0.01). (Bottom) hCD8+ cells were cultured for 24 h with or without 4-OHT and subjected to RT-PCR analysis for the expression of Laptm5 mRNAs. The level of Laptm5 expression in cells that were infected with control shRNA and cultured without 4-OHT is set as 1 (means ± standard errors of the means; n = 3 each) (∗∗, P < 0.01). (D and E) BKO/BASH-ERtm cells were infected with an hCD8-expressing retroviral vector carrying Laptm5 shRNA (Laptm5sh-1 or Laptm5sh-2) or an irrelevant control shRNA. Two days after infection, the cells were cultured for 24 h with 4-OHT (filled bars) or the control (open bars) and were subjected to flow cytometric analysis for pre-BCR expression (representative profiles are shown in panel D, and all data are summarized at the top of panel E) and immunoblot analysis for LAPTM5 expression (bottom of panel E). The top of panel E shows the relative expression level of pre-BCR in each group (means ± standard errors of the means; n = 3 each) (∗∗, P < 0.01), in that the level of expression on control cells cultured with ethanol is set as 100%. Data shown in panels A to E are representative of data from three or four independent experiments.

