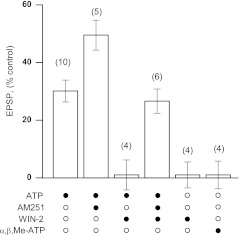
Fig. 3.
The summary of data on the induction of LTP in different combinations of ATP and cannabinoid receptor agonist/antagonist. Columns represent mean relative values of fEPSP amplitude after drug washout. The mean amplitude of fEPSP in the 10-min period before the application of any drug was defined as 100%. Solid circles denote the presence of corresponding drug in the experiment, whereas their absence in the application mixture is indicated by open circles

