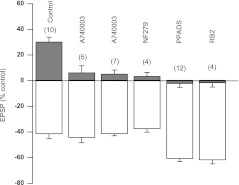
Fig. 5.
P2 receptor antagonists prevent ATP-induced LTP. The figure summarizes effects of various P2 antagonists on fEPSP amplitude. Each drug was applied 10 min before ATP and washed out simultaneously with ATP. Open columns represent maximal inhibition of fEPSP amplitude by ATP. Solid columns represent fEPSP amplitudes at the steady-state after drug washout. Numbers in brackets indicate the number of experiments

