Fig. 3.
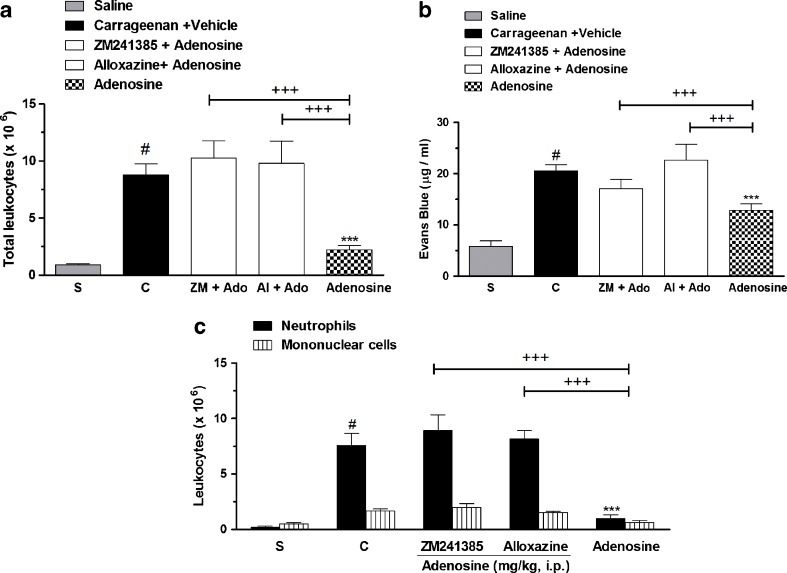
Adenosine receptor antagonists and adenosine effects on (a) total leucocytes, (b) pleural leakage, and (c) neutrophils and mononuclear cells, in pleural exudates. S represents the group injected with saline 0.9 %; C indicates the group treated with carrageenan and vehicle used to dilute adenosine or antagonists. The difference between groups was determined by ANOVA followed by Newman–Keuls multiple comparison test. *P < 0.05, ***P < 0.001 when compared with carrageenan-treated group; #P < 0.001 when compared to saline group (S); +P < 0.05, +++P < 0.001, when compared with adenosine-treated group

