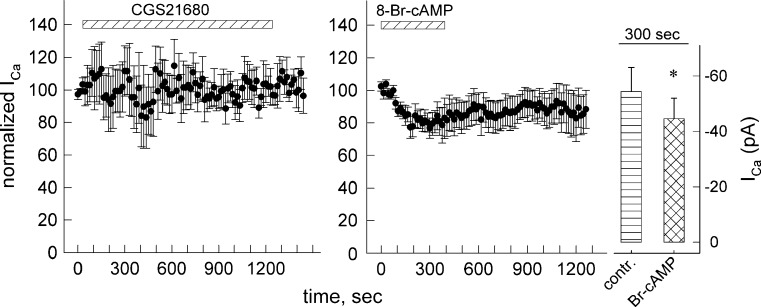
Fig. 5.
Modulation of voltage-dependent calcium current. Shown are time courses with Ca2+ current measurements in differentiated SH cells. Single cells were voltage clamped to a holding potential of −80 mV using the perforated patch modification of the whole-cell patch clamp technique. Cells were continuously superfused with buffer containing DMSO (0.05 %) and were depolarised to 0 mV for 30 ms once every 15 s. After 60 s of baseline measurement, cells were either superfused with a CGS21680 (1 μM) for 20 min or b 8-Br-cAMP (100 μM) for 5 min. The recorded values were normalised to the mean of five baseline measurements. Given are mean values ± SEM from four recordings. Exposure to 8-Br-cAMP was terminated when the current levelled out to an apparent minimum. Bar graph (right panel) shows mean current values (±SEM) before and 300 s after addition of 8-Br-cAMP; asterisk indicates significant difference (n = 7, p < 0.05, Wilcoxon signed-rank test)

