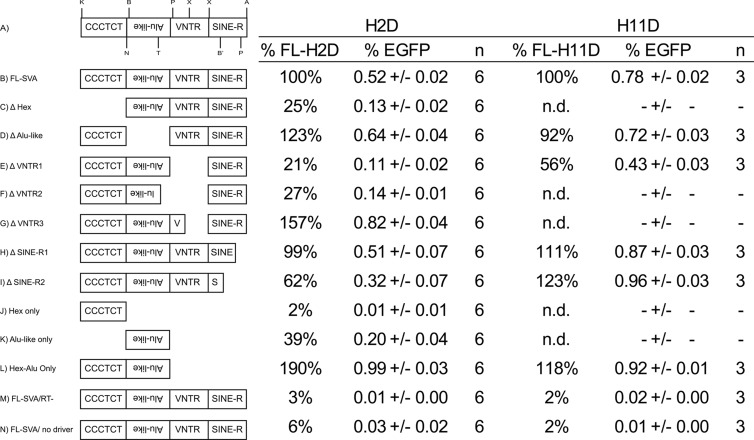
Fig 5.
SVA domain deletion analysis in U2OS cells. (A) A schematic of an SVA element with the relative positions of restriction enzyme recognition sites used for generating deletions is shown. K, KpnI; B, BlpI; N, NcoI; T, Tth111I; P, PflMI; X, XcmI; B′, BamHI; P, PpuMI; A, AgeI. (B to N) FL-SVAs (B) (SVA H2D mEGFP and SVA H11D mEGFP) or SVAs carrying a deletion (C to L) marked with the mEGFP retrotransposition indicator cassette were cotransfected into U2OS cells with ORF1/ORF2 as a driver, and retrotransposition was quantified using flow cytometry 5 days after transfection. Retrotransposition activity was scored as the number of EGFP-positive cells/number of transfected cells (% EGFP) ± standard error of the mean. FL-SVA activity was set to 100%. n, number of replicates. n.d., no data. Cotransfection of each SVA with ORF1/ORF2(RT−) (M) or no driver (N) served as a negative control.

