Fig 8.
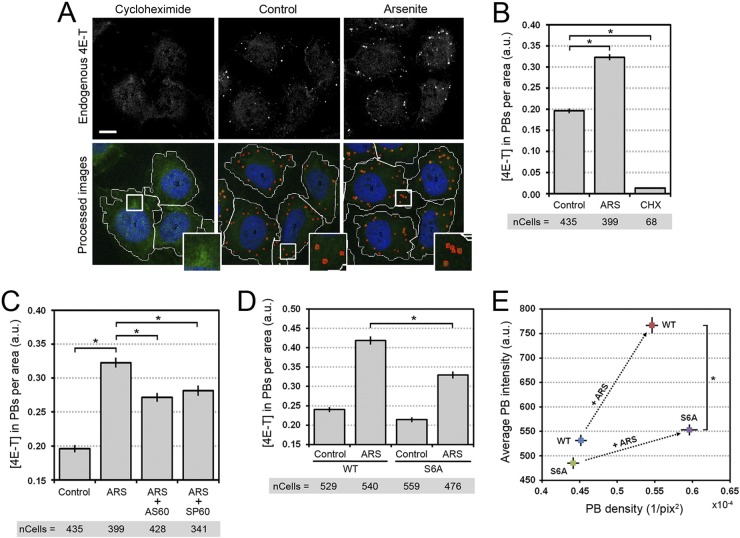
4E-T phosphorylation promotes PB assembly in response to oxidative stress. (A) U2OS cells growing in serum were treated with cycloheximide (50 μg/ml) for 1 h or arsenite (0.5 mM) for 45 min. Endogenous 4E-T was immunostained and analyzed by confocal microscopy (top). The images were processed using the software Matlab (bottom). Cell shapes were visualized by the fluorescence of the background cytoplasm, and the cell outline was traced (white lines). PBs were detected and circled (red line) on the basis of the endogenous 4E-T immunofluorescence. The number of PBs per cell and their associated intensity were reported as explained in Materials and Methods. Higher-magnification views of boxed areas are shown in the insets at the bottom right and display the recognition of PBs by the informatics program. Bar, 10 μm. (B) Data generated for panel A were analyzed to quantify the total amount of endogenous 4E-T accumulating in PBs from cells left untreated and treated with either cycloheximide (CHX) or arsenite (ARS). Error bars indicate the standard error of the mean (SEM). *, P < 0,001. a.u., arbitrary units. (C) U2OS cells were incubated with AS601245 (20 μM) or SP600125 (20 μM) for 30 min prior to treatment with arsenite. Endogenous 4E-T was immunostained and confocal images were processed as described for panel A. The amount of 4E-T localizing in PBs was determined as described for panel B. Error bars indicate the standard error of the mean. *, P < 0,001. (D) HeLa cells were transfected with wt or S6A mutant 4E-T and treated with arsenite. HA-tagged 4E-T was immunostained, and the localization of 4E-T within PBs was determined as described for panels A and B, except that 4E-T localization in PBs was normalized to its expression levels prior to quantification. Error bars indicate the standard error of the mean. *, P < 0,001. The number of cells analyzed for each condition is indicated below the bar graphs in panels B to D. (E) Representation of the distribution of wt and S6A HA-tagged 4E-T from the data in panel D. The average PB intensities were plotted over the PB densities for wt and S6A 4E-T in untreated and arsenite-treated cells. Arrows show the change in the accumulation of 4E-T in PBs upon arsenite treatment. Error bars indicate the standard error of the mean. *, P < 0,001. pix, number of pixels.

