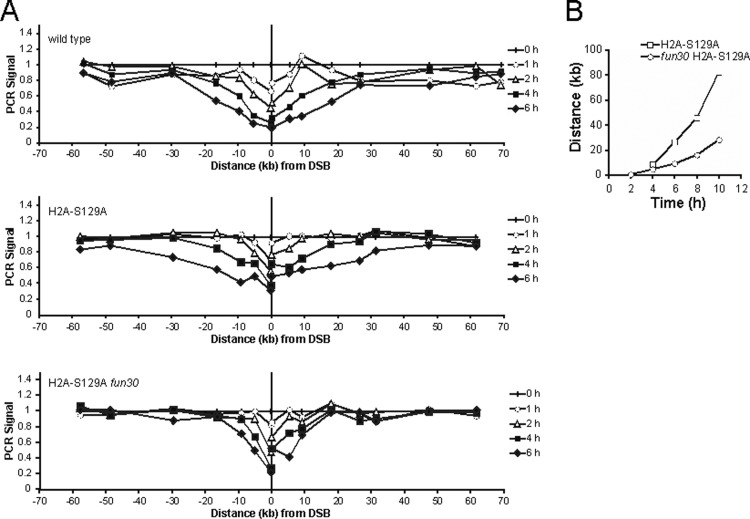
Fig 5.
DNA resection in H2A-S129 and H2A-S129A strains. (A) Quantities of DNA before and after induction were measured by qPCR using primers located at different distances from the DSB, as described for Fig. 3. DNA resection was quantitated in wild-type, H2A-S129A, and fun30Δ H2A-S129A strains. (B) The time and distance at which the PCR signal fell to 0.70 were determined for each curve and plotted on a distance-versus-time graph. The fun30Δ deletion causes resection to become slower in a H2A-S129A strain.

