Abstract
Viral load testing is an essential parameter in guiding antiretroviral therapy for individuals infected with human immunodeficiency virus type 1 (HIV-1). An external quality assessment scheme for the molecular quantification of HIV-1 RNA was introduced by the United Kingdom National External Quality Assessment Service for Microbiology in 2000. Specimen pairs of freeze-dried plasma were distributed to a median of 141 participants three times a year. The aim of this study was to analyze the quantification of HIV-1 RNA results between 2000 and 2010. Overall variability, measured by the standard deviations of all viral load results for each specimen, was below 0.5 log copy/ml (n = 48). When we compared assay results, the medians of the viral load by assay were within a range of 0.25 to 1.08 log copies/ml, with the lowest median values being consistently reported with the Siemens branched-chain DNA assay. The spread of participant results and, hence, differences between assay medians were greater when quantifying non-B subtypes. Laboratories were scored on the proximity of their reported log difference for the specimen pair to the median log difference reported by all laboratories. The overall level of performance with the HIV-1 RNA specimens over the past 10 years has been consistently good, with more than 90% of the participants reporting in the accepted range (median difference, ±0.5 log unit). Future distributions may result in tightening the acceptance levels of quantification and the use of more challenging specimens, including a variety of subtypes, with developments focusing on maintaining the clinical relevance and educational value of the scheme.
INTRODUCTION
While CD4 T cell count is the main driver for initiation of antiretroviral therapy, viral load testing is an essential parameter in guiding antiretroviral therapy for individuals with human immunodeficiency virus type 1 (HIV-1) infection. The primary goal of antiretroviral therapy is to reduce HIV-related morbidity and mortality and also to reduce HIV transmission. This is best achieved when using an efficient antiretroviral therapy that inhibits viral replication, as measured by consistent viral loads below 50 copies/ml. Plasma HIV-1 RNA levels should be determined at the time of diagnosis of HIV infection and at least every 6 months thereafter in the untreated individual (4). Plasma HIV-1 RNA levels should also be measured immediately prior to and again at 2 to 8 weeks after the patient begins antiretroviral therapy. Initial efficacy of therapy can be assessed at the second time point, because in most individuals, a potent antiretroviral therapy should result in a decrease in viral load of greater than 1 log unit by 8 weeks. In most individuals, the viral load will continue to decline and should become undetectable (<50 copies/ml) within 3 to 6 months of therapy (4). Any rebound in viral load above 50 copies/ml should be confirmed by testing a new sample. Drug resistance testing is recommended for virological rebound above 1,000 copies/ml.
When monitoring viral loads and interpreting viral load changes, clinicians must consider factors that can affect viral load results other than treatment or resistance. Indeed, normal biological variations of the plasma viral load level and technical variations (e.g., intra-assay, interassay, and interlaboratory variations) contribute to the total variability of plasma viral load measurement. Together, these factors contribute to between 0.2-log-unit and 0.3-log-unit changes in HIV-1 RNA level determinations. Therefore, variations of less than 3-fold or 0.5 log unit are not regarded as clinically significant. Variations of greater than 0.5 log unit must be viewed in the light of the patient clinical and biological history. For example, acute illness or recent vaccination may greatly affect viral load level. In most individuals, there is a concordance between the trends in HIV-1 RNA levels and CD4 T cell count, but discordance can occur. Tests for viral load with results that are inconsistent with previous trends should be repeated, as discordance may be attributable to any of the factors known to affect viral load levels (9). Repeat testing is also advisable to confirm a negative result from a patient with a previous viral load result approaching the lower limit of quantification.
Initially, the three commercially available assays in common use for HIV load determination were the HIV RNA reverse transcriptase PCR (RT-PCR) assay (Amplicor HIV-1 Monitor; Roche Molecular Systems), the branched-chain DNA (bDNA) assay (Versant HIV-1 RNA assay; Siemens), and nucleic acid sequence-based amplification (NASBA; Nuclisens HIV-1 QT; bioMérieux) (13). Real-time assays, such as the Cobas TaqMan (Roche Molecular Systems) (5), the Nuclisens EasyQ (bioMérieux) (2), and the Abbott RealTime (Abbott) (15) assays, have been developed more recently and provide higher sensitivity and a broader dynamic range than earlier assays.
An external quality assessment (EQA) scheme for the molecular quantification of HIV-1 RNA was introduced by the United Kingdom National External Quality Assessment Service (UK NEQAS) for Microbiology in 2000 and comprises three proficiency panels annually, in each of which two freeze-dried plasma specimens are distributed to participants with a request to report on the quantification of HIV-1 in each specimen. In the past 10 years of EQA provision, 30 proficiency panels amounting to a total of 60 specimens have been distributed to participants in up to 26 countries. The aim of the present retrospective study was to analyze the reports by clinical laboratories participating in the scheme on the quantification of HIV-1 RNA in freeze-dried plasma specimens distributed internationally between April 2000 and March 2010, to assess participant performance, and to assess the clinical relevance of the scheme in addressing the needs of the laboratory.
MATERIALS AND METHODS
Scheme design.
Quantitative assays for HIV-1 RNA load are used to monitor treatment. A fall or rise in HIV-1 RNA concentration of 0.5 log copy/ml is considered a significant change not attributable to testing or normal biological variations and may reflect treatment success or failure.
Each distribution consisted of two specimens of freeze-dried plasma dispatched with a request for the quantification of HIV-1 RNA (viral load assay). The two specimens consisted of a single HIV-1 RNA-positive plasma sample diluted in negative human plasma to simulate sequential samples from an HIV-infected individual. The specimens were designed to create a difference of at least 0.5 log copy/ml. Participants were asked to reconstitute the specimens using molecular-grade RNase-free water and then determine the viral load. Participants' numerical data for viral load in number of copies per ml were converted to log values, and results were considered in terms of the difference between the log values of the two specimens. This reflects common practice and standardizes the variability of results which may be expected when specimens are tested by different kits and in different laboratories.
Specimen preparation.
Positive plasma samples were obtained from the National Blood Service or purchased from commercial companies. The HIV-1 subtype was determined by the Virus Reference Laboratory, Health Protection Agency, London, United Kingdom, using the heteroduplex mobility assay or by sequencing the gag, env, and protease genes (17). Samples were stored at −80°C until required. Depending on the initial viral load, the HIV-1 RNA-positive plasma sample was diluted in normal human plasma to produce a pair of specimens according to the scheme design. To ensure stability (18), specimens were freeze-dried in a Lyoflex machine and then stored at −30°C until distribution. Freeze-dried specimens were reconstituted with molecular-grade RNase-free water immediately prior to analysis.
Specimen testing.
A range of commercially available assays was used to perform predistribution tests on each pair of specimens to determine suitability. Within each distribution, five sets of specimens were examined again to exclude deterioration of the specimen between preparation and receipt by the participants. Specimens were labeled and packed in accordance with United Kingdom and, where appropriate, international regulations for transport and postage of biological substances.
Scoring.
Participants received 2 points for reporting log differences within 0.5 log copy/ml of the median difference in concentration reported by all laboratories and 1 point for results between 0.5 and 0.75 log copy/ml of the median difference in concentration. One point was deducted when the reported log difference was greater than 0.75 log copy/ml from the median.
RESULTS
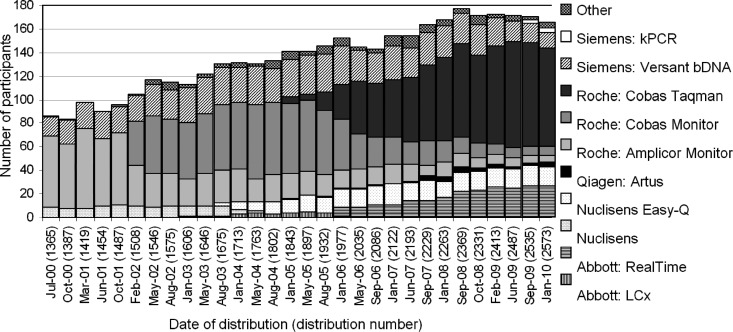
Participation in the scheme has increased steadily from the 65 laboratories when the scheme was launched in the pilot phase in August 1998. In 2010, there were 167 laboratories reporting HIV-1 RNA results in the scheme (Fig. 1): 56 from the United Kingdom, 38 from Italy, 20 from Portugal, and the remainder from 20 different countries.
Fig 1.
Assay usage over time: number of participants using each assay for each distribution indicated by date and distribution number.
When the scheme started in April 2000, participants reported using three different methods: the HIV-1 RNA RT-PCR assay (Amplicor HIV-1 Monitor; Roche Molecular Systems), the branched-chain DNA (bDNA) assay (Versant HIV RNA, version 3.0; Siemens), and nucleic acid sequence-based amplification (NASBA; Nuclisens HIV QT; bioMérieux). Over 60% of participants used the Roche Amplicor HIV-1 Monitor, and this continued to be the preferred method until February 2002, when the Cobas Monitor became the most commonly used method (Fig. 1). Along with the Abbott RealTime and the Cobas TaqMan assays, there are currently eight assays used by participants in the scheme, with 50% using the Cobas TaqMan.
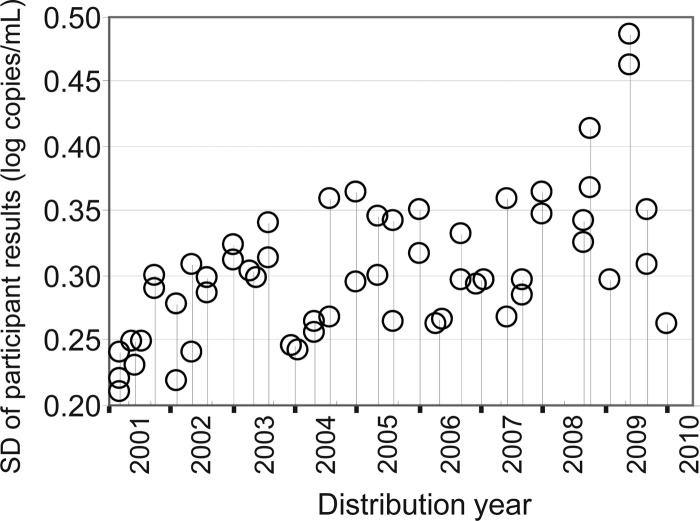
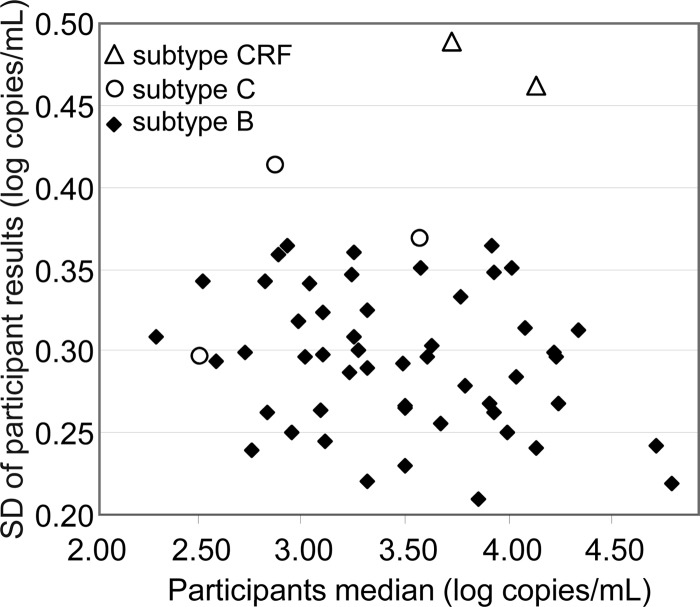
As this study was a review over a 10-year period, we started by investigating whether there had been an overall change/improvement in assay variability over the time period. Variability of HIV-1 RNA quantification was estimated by determining the standard deviation (SD) of all participant results for each of the 48 positive specimens distributed between 2002 and 2010. All SD values fell below 0.5, ranging from 0.21 to 0.49 (Fig. 2). Although SD values were consistent over time, wider SD values were observed for several specimens. We therefore investigated the possible effect of the viral load and of the HIV-1 subtype on the variability. SD values were not influenced by viral load medians, which ranged from 2.3 to 4.8 log copies/ml (Fig. 3). However, the highest SD values (>0.36) were observed with non-B subtypes, while lower SD values (≤0.36) were observed with subtype B specimens (Fig. 3).
Fig 2.
Interlaboratory variability: SDs of participant results for all HIV-1 RNA-positive specimens distributed between January 2001 and January 2010.
Fig 3.
Interlaboratory variability: SDs of participant results by viral load (participant median) and by HIV-1 subtype, B, C, or CRF.
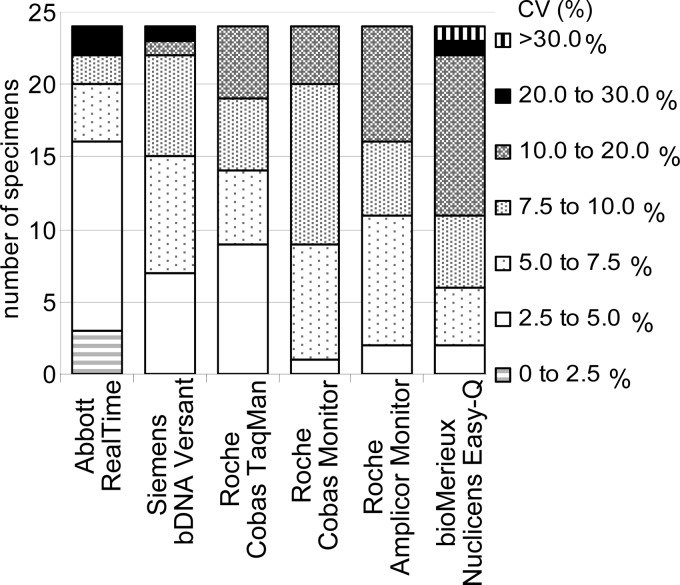
For each assay, the interlaboratory variability was assessed by determining the coefficient of variation of the viral loads expressed in number of copies/ml. Twenty-four specimens distributed over the past 4 years were analyzed to compare assays in current usage. Some high values were due to a small number of laboratories reporting aberrant results in certain distributions. Over the last 4 years, the Abbott RealTime, Siemens bDNA, and Cobas TaqMan assays had the lowest coefficient of variation, with most of the 24 specimens reported to have a coefficient of variation below 10% (Fig. 4). Since 2009, participants have reported results using Siemens kinetic PCR (kPCR) and Roche Cobas TaqMan (version 2) for 3 specimens with coefficients of variation of less than 10%.
Fig 4.
Assay variability: number of specimens within different coefficient of variation (CV) ranges by assay for the 24 most recent specimens.
Medians of the viral loads for each assay were compared for the same 24 specimens (Fig. 5). Medians obtained for the Siemens bDNA assay were the lowest for 23 out of the 24 specimens analyzed and were significantly lower than the overall result medians (P = 0.008), with a difference of −0.42 log unit, on average (Fig. 5). This difference was greater when specimens contained non-B subtypes (−0.79 log unit, n = 5) than when specimens contained B subtypes (−0.32 log unit, n = 19). The Roche TaqMan assay yielded the highest median values for 18 out of the 24 specimens and the second-highest values for the 6 other specimens (Fig. 5), with an average difference of +0.15 log unit. However, this difference was not statistically significant (P = 0.187). The median values for each assay were within a range of from 0.25 to 1.08 log units for the 24 specimens analyzed. Interestingly, the five widest log-unit ranges (0.7 to 1.08) were all obtained when specimens contained non-B subtypes. Median values for specimens containing B subtypes were within the 0.25- to 0.69-log-unit range.
Fig 5.
Interassay variability: median viral load by assay for 24 specimens distributed during the period from 2006 to 2010 sorted by increasing viral load.
Participants correctly reported the presence of HIV-1 RNA in all specimens distributed with viral loads as low as 2.83 log copies/ml of subtype B HIV-1 RNA and 2.88 log copies/ml of non-subtype B HIV-1 RNA. False-negative results were infrequent and reported for only 7 of the 24 most recent specimens. The number of false-negative results by specimen was less than five (<3% of participants) and not method related for five specimens which contained more than 2.6 log copies/ml (400 copies/ml). The number of false-negative results was significantly higher (P < 0.001) for two specimens containing 2.30 log copies/ml of subtype B (24 of 168 results) and 2.52 log copies/ml of non-subtype B (20 of 143 results), respectively. False-negative results were reported by participants using assays with the highest lower limit of detection of 2.6 log copies/ml (Roche Amplicor Monitor and Roche Cobas Monitor) and also by participants using assays with limits of detection of 1.7 log copies/ml or lower (Table 1). Although the Siemens bDNA assay has a stated lower limit of detection of 1.7 log copies/ml, underquantification may have contributed to the highest rate of false-negative results (Table 1).
Table 1.
Negative results by assay for two specimens with low viral loads
| HIV-1 type | Median viral load (log copies/ml) | No. (%) of specimens with negative results by the following assay: |
|||||
|---|---|---|---|---|---|---|---|
| Siemens bDNA Versant (1.7)a | bioMérieux Nuclisens (1.4) | Roche Amplicor Monitor (2.6) | Roche Cobas Monitor (2.6) | Roche Cobas TaqMan (1.6) | Abbott RealTime (1.6) | ||
| B | 2.30 | 11 (64.7) | 7 (43.8) | 1 (20.0) | 1 (20.0) | 1 (1.6) | 2 (7.7) |
| Non-B | 2.52 | 12 (47.8) | 4 (25.0) | 1 (12.5) | 1 (14.3) | 1 (1.3) | 0 (0.0) |
Values in parentheses represent the limit of detection (in log copies/ml).
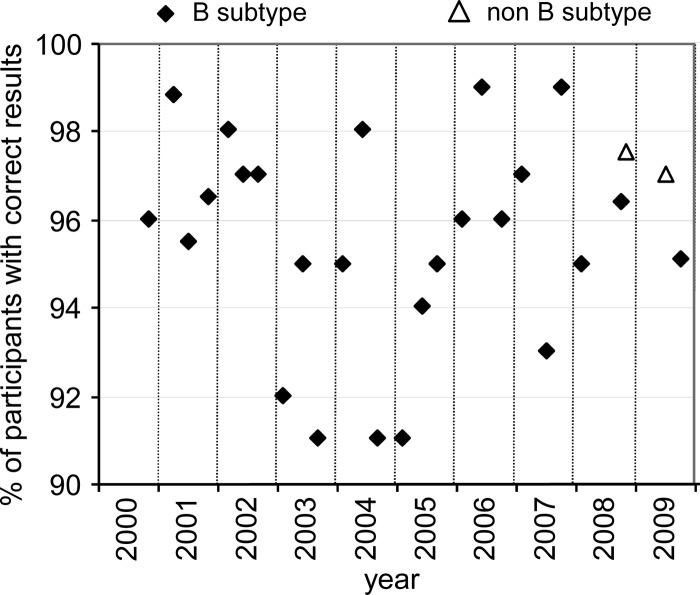
Participants were asked to report on the log copies/ml measured for each specimen, generating a difference within the pair of specimens expressed in log copies/ml. Participants reporting a difference within ±0.5 log unit of the median of participant differences were allocated a full score. Two specimen pairs, one from 2009 and one from 2010, each including one negative specimen, were excluded from this performance analysis. A total of 27 pairs of HIV-1 RNA-positive plasma specimens were distributed to between 77 and 177 participants in the 2000 to 2009 period. Twenty-five pairs were prepared from HIV-1 RNA subtype B, and two pairs were prepared from HIV-1 RNA non-subtype B. Between 91% and 99% of participants achieved a full score (Fig. 6).
Fig 6.
Percentage of participants reporting to within 0.5 log copy/ml of the median difference in viral load for each pair of HIV-1 RNA-positive specimens.
DISCUSSION
The importance of plasma viral load in assessing the prognosis and in monitoring the treatment of HIV-1 infection was recognized in the 1990s (7, 11). Quantification of HIV-1 RNA in plasma has become an essential parameter for monitoring treatment (4, 10), and the number of diagnostic laboratories offering the testing has increased. The number of assays has also expanded, and more commercial kits based on different nucleic acid testing technologies have become available, with a trend to develop versions that allow high throughput and a wider range of quantification. A quality assurance program is necessary for diagnostic laboratories to document analytical uncertainty and promote confidence in analytical results. This can be achieved by running quality controls and by regularly assessing the quality control program through participation in external quality assessment schemes. Here we analyzed HIV-1 RNA quantification results reported over a 10-year period of external quality assessment and showed that participation in the UK NEQAS HIV-1 RNA quantification scheme is a valuable tool to demonstrate reliability of results in the follow-up of HIV-1-infected individuals.
Over a 10-year period from 2000 to 2010, participation in the scheme doubled, reflecting the increasing importance of measuring the HIV-1 RNA load to manage infected individuals. During this period, real-time assays progressively replaced endpoint assays, starting with the appearance of the Nuclisens EasyQ assay in 2003 and, more recently, the Siemens kPCR assay. Real-time assays improved throughput, turnaround time, and reproducibility of results by combining automation with real-time quantification technologies (e.g., cleaved dual-labeled probes and molecular beacon probes). In 2010, 85% of participants were using a real-time assay.
Our data show that the interlaboratory variability was the least for the Abbott RealTime and the Siemens bDNA Versant assays. This confirmed the results of previous studies comparing Siemens bDNA Versant with the bioMérieux Nuclisens QT and Roche Cobas Monitor Amplicor (version 1.5) assays or an in-house assay (3, 13). As expected, fully automated assays, for example, the Abbott RealTime assay, yielded less variability, and manual assays, such as Roche Amplicor Monitor, yielded greater variability. Indeed, automation of the amplification/quantification step (Roche Cobas Monitor) and of the extraction step (Roche Cobas AmpliPrep/Cobas TaqMan) improved the interlaboratory variability, with the percent coefficient of variation being reduced to less than 5% for 9 of the 24 specimens for the Roche Cobas TaqMan compared with just one specimen with the Roche Cobas Monitor. Changes in the technology of the Roche assays, from endpoint PCR to real-time PCR, most likely also contributed to improvements in result reproducibility. Although the bioMérieux Nuclisens EasyQ is a semiautomated assay, the results demonstrated the greatest variability. This could be due to the bioMérieux assay being an open system offering a free choice of extraction assays and the possibility to quantify from three different volumes of plasma.
Standardization of HIV-1 RNA quantification assays started in 1999, when the first WHO/international HIV-1 RNA standard was introduced. Most of the assays currently used are calibrated against the WHO standard, which was prepared from an HIV-1 RNA genotype B sample (Cobas TaqMan, Nuclisens EasyQ, Abbott RealTime). Both Siemens assays, bDNA and kPCR, were developed with standards of the U.S. National Institute of Standards and Technology (NIST). We observed that overall variability for testing HIV-1 RNA subtype B ranged from 0.21 to 0.36 log copy/ml, with standard deviations of less than 0.31 obtained for 33 out of 52 specimens. Specimen median viral loads for each assay fell within a range of 0.25 to 1.09 log copies/ml for the 24 specimens sent between 2006 and 2010. The use of a single international standard together with the expression of viral load results in IU/ml could reduce differences in the results obtained with different assays. These data also showed that the Siemens bDNA Versant assay consistently resulted in the lowest median viral load compared to the other assay medians, indicating a potential underquantification (on average, −0.32 log unit), as previously reported by others (3, 8, 14). The calibration of the Siemens assays to the U.S. NIST standard may contribute to the apparent underquantification and false-negative results for the subtype B specimen with the lowest viral load (2.3 log units), for which a significant number of Siemens bDNA assay users (11 out of 17) reported a negative result. The same specimen was missed by 43.8% of the users of the bioMérieux Nuclisens EasyQ assay (limit of quantification, 1.4 log units), although this assay gave inconsistently low viral load results for the other specimens. Overall, these data suggest that 1 copy of the U.S. NIST standard quantifies to more than 1 copy of the WHO standard. Therefore, in clinical practice, underquantification with the Siemens bDNA assay may result in negative results for samples containing 2.5 log copies/ml or less as measured by assays calibrated with the WHO standard. This illustrates the need for assays to be calibrated against a common standard. The present EQA scheme shows that the Siemens bDNA assay performs as well as the other assays in detecting significant changes in the viral load of at least 0.5 log unit and is therefore a useful assay for monitoring the HIV RNA load. These observations reinforce the commonly held view and practice that HIV-infected individuals should be monitored with testing using the same assay to eliminate the variation in viral load inherent to the different assays, which could confuse the clinical situation.
HIV-1 strains have been phylogenetically classified into distinct groups (M, N, O, P), with the group M strains subdivided into nine subtypes, A to D, F to H, J, and K (12). Subtype B is predominant in Europe, but recent studies have revealed that non-B strains are responsible for nearly 25% of viruses circulating in the United Kingdom (1, 17) and 45% in France (6). Studies have shown that HIV-1 genetic diversity can compromise the reliability of detection and the accuracy of quantification of both conventional and real-time PCR viral load tests (16). Herein we confirmed that quantification of specimens containing subtype C (n = 3) and CRF02_AG (n = 2) is less accurate than quantification of specimens containing subtype B. For specimens containing non-B subtypes, overall variability was increased and the method median log copies/ml fell over a broader range (0.70 to 1.09 log units). Only subtype B standards are available, and thus, it is important for HIV-1 RNA quantification assays to be critically evaluated using well-characterized panels of genetically divergent strains. Resistance testing now forms part of the initial profiling for newly diagnosed individuals, and this provides broad information on the genotype. The advent of next-generation sequencing makes genotyping of all newly diagnosed individuals feasible. Awareness of the genotype would be useful as part of the clinical care monitoring.
Laboratories participating in this EQA scheme over the last 10 years have consistently performed well. The follow-up of treated HIV-1-infected individuals relies on detecting the initial drop of the viral load within the first 2 months of treatment and on further monitoring of viral suppression every 3 to 6 months. Good performance in this scheme reflects the ability of participating laboratories to detect significant changes of the viral load (±0.5-log-unit difference) and gives participants confidence in their respective procedures. However, for specimen pairs with just a 0.5-log-unit difference in viral load, the scoring system inappropriately rewarded participants who reported no significant difference (difference, <0.5 log unit), as the range of acceptability allowed reporting within ±0.5 log unit. Acceptance levels have been further tightened and currently allow reporting within ±0.3 log copy/ml of the participant median difference. Future developments will focus on maintaining the clinical relevance and educational value of the scheme. Optimal viral suppression is generally defined as a viral load persistently below 50 copies/ml, and therefore, future distributions should include specimens with low levels of 50 to 200 copies/ml. Also, more non-B-subtype specimens should be distributed, as emerging HIV-1 strains have become an everyday challenge to routine testing. The inclusion of additional specimen pairs to the program will be considered to ensure coverage of a wider range of viral loads and genotypes.
ACKNOWLEDGMENTS
We thank all participating laboratories; Liz Fagan and Anneline Rossouw at UK NEQAS for Microbiology; colleagues from St. Thomas' Hospital in London; the HPA laboratories in Bristol and Cambridge; Sheffield Microbiology Laboratory at Sheffield Teaching Hospitals Trust; the Virus Reference Division at HPA in London; the Department of Microbiology at the University Hospital of Wales in Cardiff; and St. Mary's Hospital in London for testing the specimens and Tom Nichols from the Statistical Unit, HPA Colindale, for his help with the statistical analysis of the data.
Footnotes
Published ahead of print 5 September 2012
REFERENCES
- 1.Aggarwal I, et al. 2006. Evidence for onward transmission of HIV-1 non-B subtype strains in the United Kingdom. J. Acquir. Immune Defic. Syndr. 41:201–209 [DOI] [PubMed] [Google Scholar]
- 2.de Mendoza C, et al. 2005. Multicenter evaluation of the NucliSens EasyQ HIV-1 v1.1 assay for the quantitative detection of HIV-1 RNA in plasma. J. Virol. Methods 127:54–59 [DOI] [PubMed] [Google Scholar]
- 3.Domiati-Saad R, Scheuermann RH. 2006. Nucleic acid testing for viral burden and viral genotyping. Clin. Chim. Acta 363:197–205 [DOI] [PubMed] [Google Scholar]
- 4.European AIDS Clinical Society. 2011. Guidelines version 6, October 2011. European AIDS Clinical Society, Paris, France: http://www.europeanaidsclinicalsociety.org/images/stories/EACS-Pdf/eacsguidelines-v6_english.pdf. [Google Scholar]
- 5.Katsoulidou A, et al. 2006. Evaluation of the clinical sensitivity for the quantification of human immunodeficiency virus type 1 RNA in plasma: comparison of the new COBAS TaqMan HIV-1 with three current HIV-RNA assays—LCx HIV RNA quantitative, VERSANT HIV-1 RNA 3.0 (bDNA) and COBAS AMPLICOR HIV-1 Monitor v1.5. J. Virol. Methods 131:168–174 [DOI] [PubMed] [Google Scholar]
- 6.Lot F, et al. 2004. Preliminary results from the new HIV surveillance system in France. Euro Surveill. 9:34–37 [PubMed] [Google Scholar]
- 7.Mellors JW, et al. 1996. Prognosis in HIV-1 infection predicted by the quantity of virus in plasma. Science 272:1167–1170 [DOI] [PubMed] [Google Scholar]
- 8.Murphy DG, Cote L, Fauvel M, Rene P, Vincelette J. 2000. Multicenter comparison of Roche COBAS AMPLICOR MONITOR version 1.5, Organon Teknika NucliSens QT with extractor, and Bayer Quantiplex version 3.0 for quantification of human immunodeficiency virus type 1 RNA in plasma. J. Clin. Microbiol. 38:4034–4041 [DOI] [PMC free article] [PubMed] [Google Scholar]
- 9.Nolte FS. 1999. Impact of viral load testing on individual care. Arch. Pathol. Lab. Med. 123:1011–1014. [DOI] [PubMed] [Google Scholar]
- 10.Panel on Antiretroviral Guidelines for Adults and Adolescents 2011. Guidelines for the use of antiretroviral agents in HIV-1-infected adults and adolescents. U.S. Department of Health and Human Services, Washington, DC: http://www.aidsinfo.nih.gov/ContentFiles/AdultandAdolescentGL.pdf Accessed 14 October 2011 [Google Scholar]
- 11.Pantaleo G, et al. 1995. Studies in subjects with long-term nonprogressive human immunodeficiency virus infection. N. Engl. J. Med. 332:209–216 [DOI] [PubMed] [Google Scholar]
- 12.Plantier JC, et al. 2009. A new human immunodeficiency virus derived from gorillas. Nat. Med. 15:871–872 [DOI] [PubMed] [Google Scholar]
- 13.Schmitt Y. 2001. Performance characteristics of quantification assays for human immunodeficiency virus type 1 RNA. J. Clin. Virol. 20:31–33 [DOI] [PubMed] [Google Scholar]
- 14.Stevens W, Horsfield P, Scott LE. 2007. Evaluation of the performance of the automated NucliSENS easyMAG and EasyQ systems versus the Roche AmpliPrep-AMPLICOR combination for high-throughput monitoring of human immunodeficiency virus load. J. Clin. Microbiol. 45:1244–1249 [DOI] [PMC free article] [PubMed] [Google Scholar]
- 15.Swanson P, et al. 2006. Performance of the automated Abbott RealTime HIV-1 assay on a genetically diverse panel of specimens from London: comparison to VERSANT HIV-1 RNA 3.0, AMPLICOR HIV-1 MONITOR v1.5, and LCx HIV RNA quantitative assays. J. Virol. Methods 137:184–192 [DOI] [PubMed] [Google Scholar]
- 16.Swanson P, et al. 2007. Evaluation of performance across the dynamic range of the Abbott RealTime HIV-1 assay as compared to VERSANT HIV-1 RNA 3.0 and AMPLICOR HIV-1 MONITOR v1.5 using serial dilutions of 39 group M and O viruses. J. Virol. Methods 141:49–57 [DOI] [PubMed] [Google Scholar]
- 17.Tatt ID, Barlow KL, Clewley JP, Gill ON, Parry JV. 2004. Surveillance of HIV-1 subtypes among heterosexuals in England and Wales, 1997-2000. J. Acquir. Immune Defic. Syndr. 36:1092–1099 [DOI] [PubMed] [Google Scholar]
- 18.Vaughan H, Chalker VJ, Mee Z, Rossouw A, James V. 2006. Stability of lyophilised specimens for the molecular detection of viral DNA/RNA. J. Clin. Virol. 35:135–140 [DOI] [PubMed] [Google Scholar]


