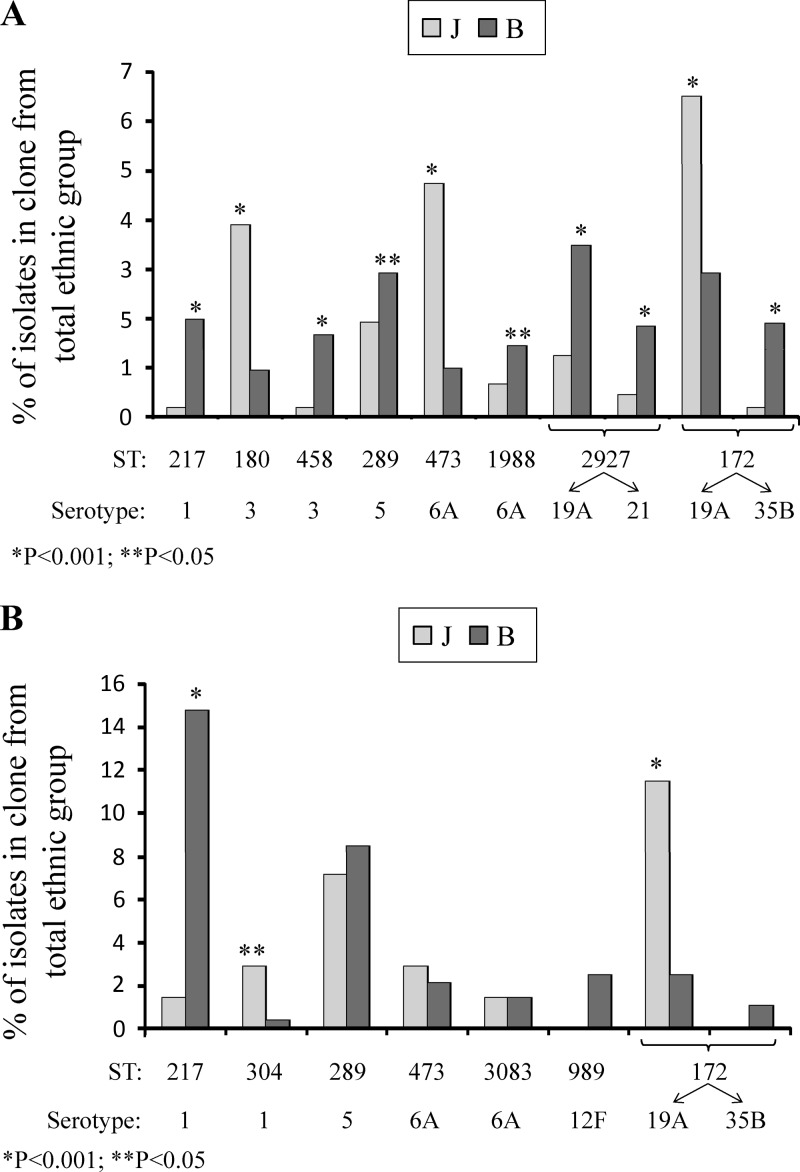
Fig 1.
(A) Distribution of the major STs among Jewish (J) and Bedouin (B) children in the AOM group. P values were calculated for each ST relative to the total number of isolates in each ethnic group (Jewish children, 2,267; Bedouin children, 2,969). (B) Distribution of the major STs among Jewish (J) and Bedouin (B) children in the IPD group. P values were calculated from total number of isolates in each ethnic group (Jewish children, 140; Bedouin children, 285).

