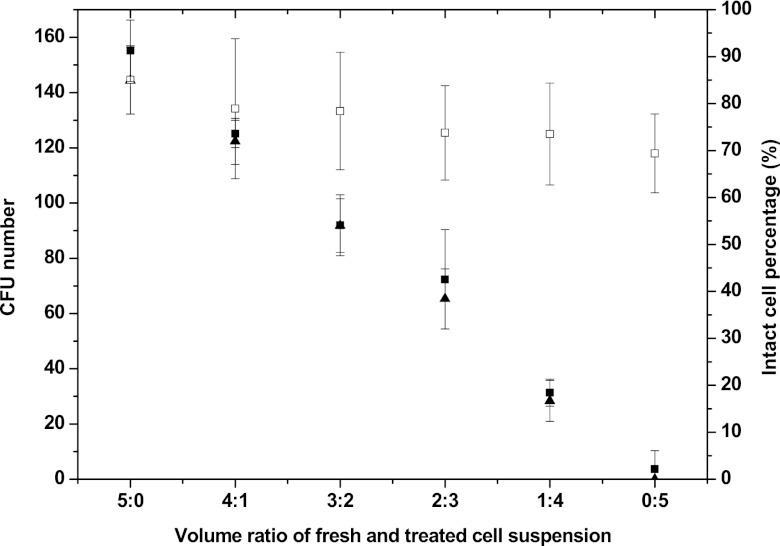
Fig 5.
Correlation between LIVE/DEAD staining and microbiological culturing results when applied to heat-treated (80°C for 35 min) and cryokilled (fast cooled in liquid nitrogen) BCG cells. ▲, CFU numbers for mixtures of fresh and heat-killed BCG cells; ■, intact-cell percentages for mixtures of fresh and heat-treated BCG cells; □, intact-cell percentages for mixtures of fresh and cryotreated BCG cells. The error bars indicate standard deviations.

