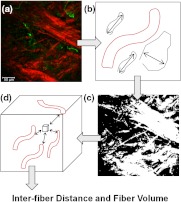
Fig. 1.
Construction of inter-fiber distance and fiber volume. Composite image (a) of the collagen I (Col1) fibers (red) and cell nuclei (green); preprocessing using the optional filter (b) to identify fiber-like objects (red) among various non-fiber-like objects in the image to produce the corresponding Col1 fiber image (c); (d) computing the distances from each 3-D voxel to the surrounding fibers in 3-D to determine the nearest distance to a fiber in μm and the total fiber volume (%). One -plane from a 3-D image stack is displayed in (a) and (c). Each image size is 339 by 339 μm. The scale bars represent 50 μm.

