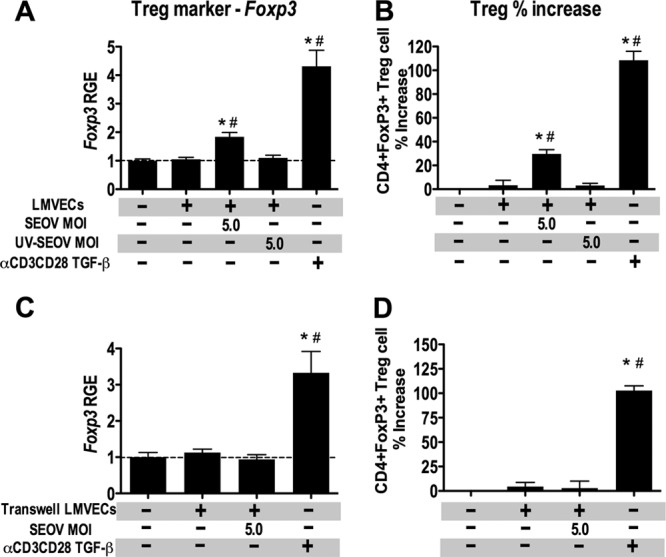
Fig 7.

Induction of Treg cells in allogeneic CD4+ T cell cultures by SEOV-infected LMVECs requires SEOV replication and cell contact. (A) LMVECs from Sprague-Dawley rats were inoculated with medium alone, medium containing SEOV, or medium containing UV-inactivated SEOV. At 1 day p.i., splenic CD4+ T cells from Brown Norway rats were added to LMVEC cultures at a LMVEC/T cell ratio of 1:10. After 4 days of coculture, nonadherent cells were collected, and the expression of Foxp3 was quantified by real-time PCR and is expressed as RGE compared to CD4+ T cells cultured alone. The data are expressed as means and SEM from three independent experiments. (B) The frequency of CD4+ FoxP3+ Treg cells among the cocultured cells was analyzed by flow cytometry. The percent change in Treg cell frequencies among CD4+ T cells cultured with LMVECs relative to CD4+ T cells cultured alone from three independent experiments is expressed as means and SEM. (C) For transwell coculture experiments, LMVECs from Sprague-Dawley rats were cultured in the bottom chambers of transwells and inoculated with medium alone or with medium containing SEOV. Splenic CD4+ T cells from Brown Norway rats were stimulated with a combination of plate-bound anti-CD3 and soluble anti-CD28. At 3 days p.i., stimulated CD4+ T cells were added to the upper chambers of the transwells to eliminate LMVEC-CD4+ T cell contact. After 2 days of coculture, CD4+ T cells in the upper chambers were collected, and the expression of Foxp3 was quantified by real-time PCR and expressed as RGE compared to CD4+ T cells cultured alone in the upper chambers without LMVECs in the lower chamber. The data are expressed as means and SEM from three independent experiments. (D) The frequency of CD4+ FoxP3+ Treg cells among the CD4+ T cells in the upper chamber was analyzed by flow cytometry. The percent change in Treg cell frequencies relative to CD4+ T cells cultured alone from three independent experiments is expressed as means and SEM. *, significant difference relative to CD4+ T cells cultured alone; #, significant difference relative to CD4+ T cells cocultured with mock-infected LMVECs; P < 0.05; one-way ANOVA. The dashed lines represent the gene expression level of CD4+ T cells cultured alone.
