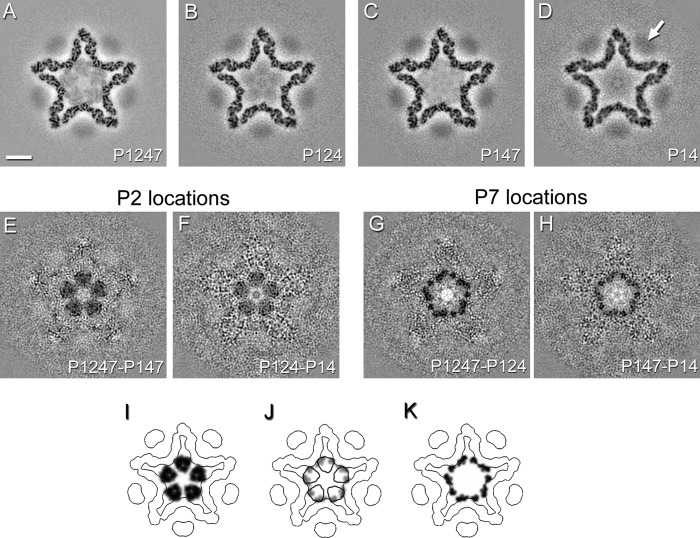
Fig 3.
(A to D) Slices through icosahedral reconstructions of ϕ6 procapsids filtered to 8-Å resolution and viewed along the 5-fold icosahedral axis ∼73 Å from the procapsid center. Bar, 100 Å. The P4 density is indicated in the map of the P14 procapsid (white arrow). (E to H) Difference maps calculated between P1247 and P147 procapsids or P124 and P14 procapsids show locations of P2, while the difference maps calculated between P1247 and P124 procapsids or P147 and P14 procapsids show locations of P7. (I to K) Corresponding slices through models of P2 and P7 in the procapsid, determined by fitting the P2 structure (PDB ID 1UVJ) and the P7 homology model into the difference maps (see the text). The densities are shown for P2 (I) and P7 (K) subunits. An overlay of the P2 (black contour) and P7 (gray density) locations is shown in panel J.

