Fig 5.

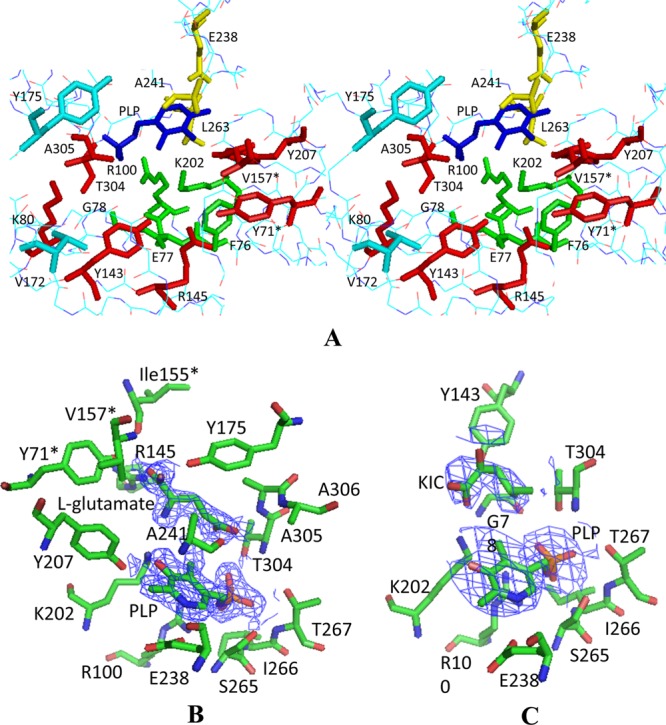
Active site of native DrBCAT. (A) Stereo view of the active site residues. The PLP (dark blue) is located at the bottom of the active site pocket surrounded by the residues from varied orientations—at the bottom (green), near the structural surface (red), at the interdomain loop (turquoise), and at the positions behind and above the aldehyde group of PLP (yellow). (B) Cofactors and substrates in the active sites of the DrBCAT–l-glutamate complex. (C) Cofactors and substrates in the active sites of DrBCAT–l-KIC. The omit electron density maps (contoured ≥ 1.0 σ) with the coefficient 2Fo–Fe were calculated for DrBCAT–l-glutamate at a resolution of 2.0 Å and for DrBCAT-KIC at a resolution of 3.0 Å, respectively.
