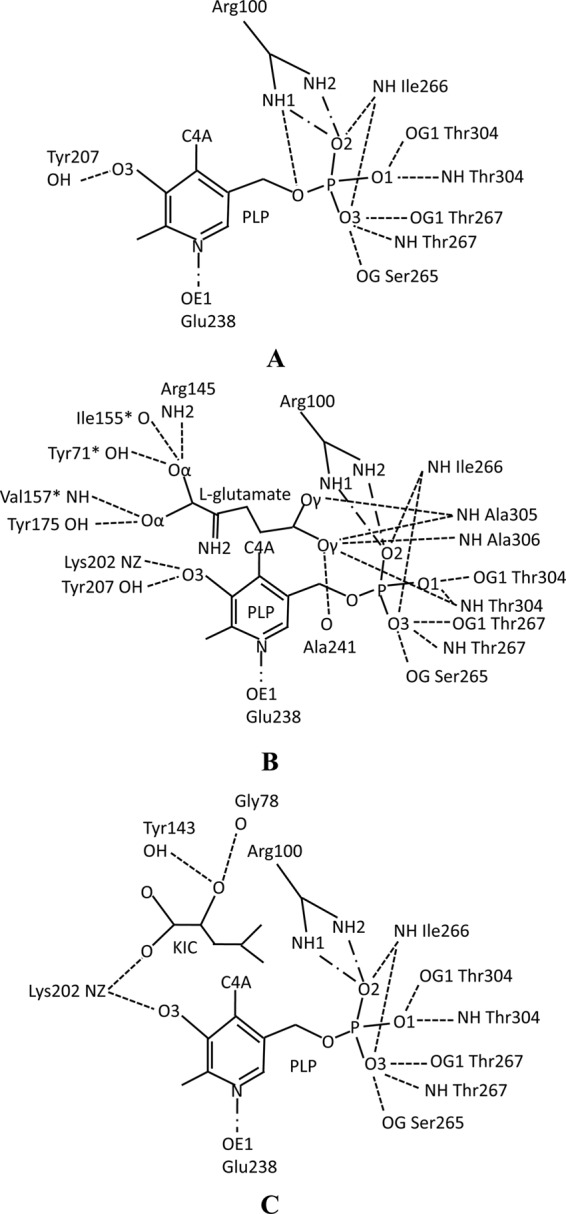
Fig 6.

Schematic diagram of interaction networks with hydrogen bonds and salt bridges among the PLP, substrates, and residues. (A) Interactions for the native DrBCAT monomer. (B) Interactions for the DrBCAT–l-glutamate complex. (C) Interactions for the DrBCAT-KIC complex. The PLP as a cofactor was located at the bottom of the active site pocket with its re-face toward the DrBCAT. The interactions of hydrogen bonds (broken lines) and salt bridges (lines made of a long dash, a dot, and a long dash) are shown.
