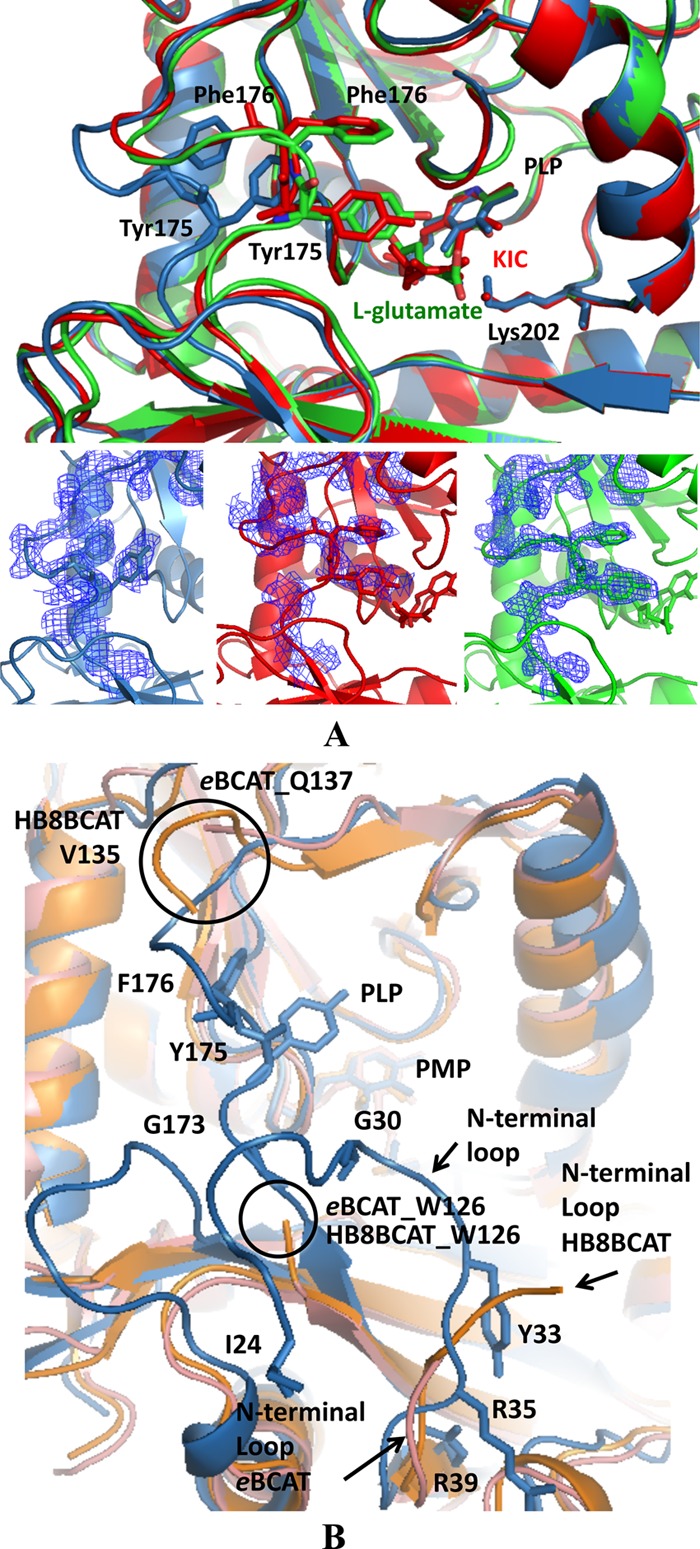
Fig 7.

Molecular surface of the active site and interdomain loop. (A) Structural comparison of the active sites of native DrBCAT (blue), DrBCAT–l-glutamate (green), and DrBCAT-KIC (red). The active site exhibits an open form in native DrBCAT, whereas it becomes a closed form once the l-glutamate substrate or KIC binds to the active site, because of the dynamics and flexibility of the interdomain loop. The composite omit electron density maps with coefficient 2Fo–Fc of the interdomain loops are shown for native DrBCAT, DrBCAT–l-glutamate, and DrBCAT-KIC at the bottom of panel A. (B) Structural comparison of native DrBCAT-PLP, eBCAT-PLP, and HB8BCAT-PMP. Superimposing the structures of the native DrBCAT (blue), eBCAT (salmon), and HB8BCAT (orange) reveals that the interdomain loop is highly flexible and disordered without electron densities in eBCAT and HB8BCAT, whereas the loop is clearly visible with large B-factors in DrBCAT. The N-terminal loop in DrBCAT is longer than those in eBCAT and HB8BCAT. Residues Tyr175 and Phe176 exhibit an edge-to-face interaction in the interdomain loop in DrBCAT. The black circles indicate the disordered ends of the interdomain loops of eBCAT and HB8BCAT.
