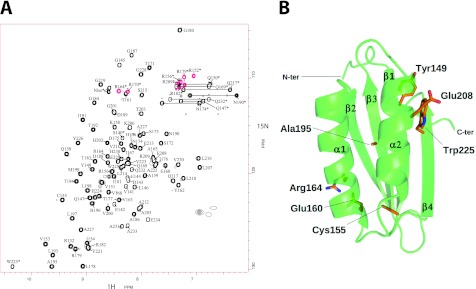
Fig 2.
NMR structure of M. tuberculosis MgtC_Cter. (A) [1H-15N] HSQC spectrum of MgtC_Cter from M. tuberculosis recorded at 27°C on an 15N-uniformly labeled sample. Cross-peak assignments are indicated using the one-letter amino acid and number. Red cross peaks corresponds to the “refolded” arginine side chains from the region at 80 to 90 ppm. Stars indicate cross peaks from side-chain atoms. (B) The overall three-dimensional structure of M. tuberculosis MgtC_Cter is shown as a green ribbon. Secondary structures are numbered following the nomenclature of ACT domains. The side chains of the seven residues strictly conserved among orthologous MgtC from intracellular pathogens (see alignment in Fig. 3A) are shown in wire frame representation (with carbon, nitrogen, oxygen, and sulfur atoms colored in orange, blue, red, and yellow, respectively). Residues are numbered following the mycobacterial sequence.

