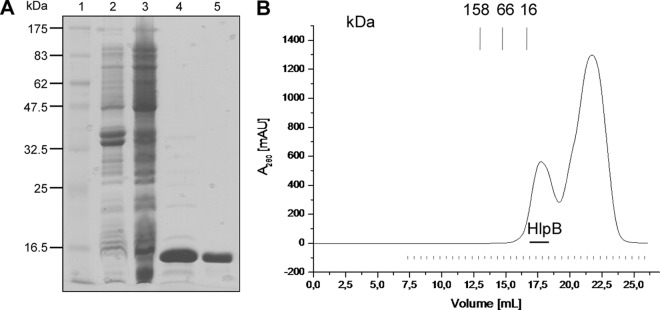
Fig 3.
Purification of HlpB after heterologous expression in E. coli. (A) Coomassie-stained SDS-PAGE of purification steps. Lane 1, marker; lane 2, cell extract from noninduced E. coli strain; lane 3, cell extract after induction of HlpB synthesis; lane 4, elution fraction after immobilized metal ion affinity chromatography (IMAC) on Ni2+-Sepharose; lane 5, elution fraction after gel filtration. (B) Elution profile of gel filtration chromatography on superose. Absorption at 280 nm is shown in black. Fractions containing HlpB are designated by the horizontal line; values representing elution of marker proteins are given above the graph.

