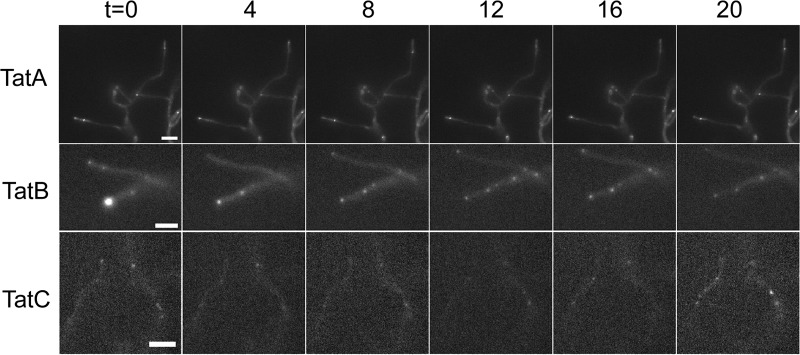
Fig 4.
Dynamic localization of TatA-eGFP, TatB-eGFP, and TatC-eGFP in vegetative hyphae. The images shown were taken from Movies SV6, SV2, and SV4 in the supplemental material, respectively, and represent 4-min time intervals. The strains and image settings are the same as those in Fig. 3. Scale bars, 2 μm.

