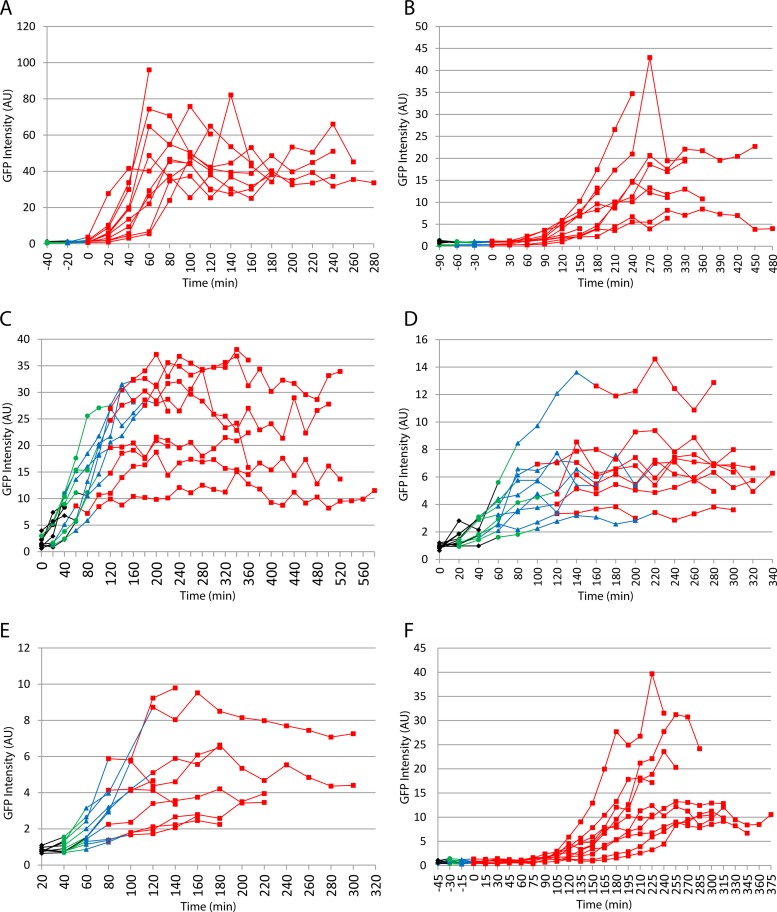
Fig 5.
Activation of σG- and σF-directed gene expression in individual cells analyzed by time lapse microscopy. Time traces of individual cells. (A) SL10969, standard strain, σG reporter; (B) Strain SL15103, termination of replication at 145° and σG reporter; (C) SL15660, termination of replication at 145° and σF reporter at 28°; (D) SL15634, termination of replication at 145° and σF reporter at 140°; (E) SL15648, termination of replication at 145° and σF reporter at 161°; (F) SL14469; slow DNA translocase and σG reporter. Bacteria were maintained at 30°C, and successive images were captured at the indicated times. Expression from gfp transcriptional fusions was observed as green fluorescence, which was measured in arbitrary units that are not comparable between strains. For strains expressing a σF-directed reporter, times are normalized (time zero) to the first image to show the sporulation septum (stage IIi). For strains expressing a σG-directed reporter, time traces of individual bacteria are normalized (time zero) to the first image showing completion of engulfment (stage III). The different stages of engulfment are indicated by different colors: black is stage IIi, green is stage IIii, blue is stage IIiii, and red is stage III.

