
Figure 6. Serum TAS levels are increased in free-living healthy seniors receiving NS-7 or NS-6 capsules, and in hypercholesterolemic subjects who were restricted to the AHA Step-1 diet plus intake of NS-7 or NS-6 capsules.
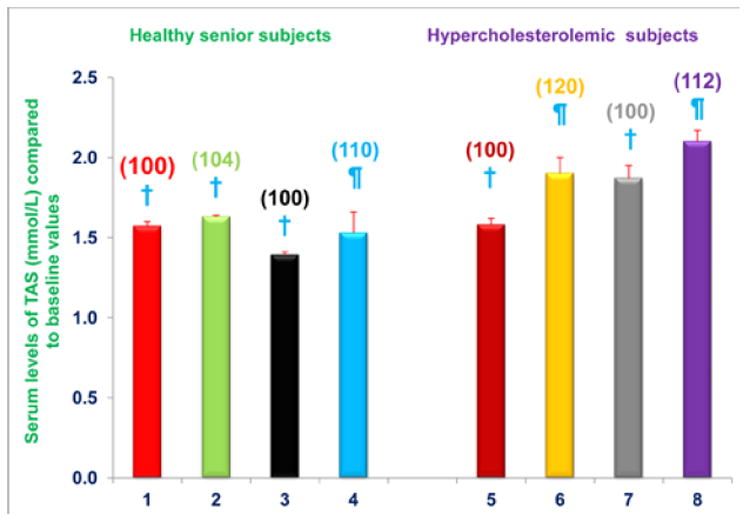
Columns 1-4 represent Group 1 subjects with normal initial total cholesterol levels. 1 = Baseline TAS for 30 subjects; 2 = TAS for column 1 subjects after four weeks diet supplementation with NS-7 (Subgroup A); 3 = Baseline TAS for 39 subjects; 4 = TAS for column 3 subjects after four weeks diet supplementation with NS-6 (Subgroup B). Columns 5-8 represent Group 2 subjects with elevated initial total cholesterol levels. 5 = Baseline TAS for 41 subjects; 6 = TAS for column 5 subjects four weeks after changing to the AHA Step-1 diet and supplementation with NS-7 (Subgroup C); 7 = Baseline TAS for 30 subjects; 8 = TAS for column 7 subjects four weeks after changing to the AHA Step-1 diet and supplementation with NS-6 (Subgroup D). Data are means ± SE. Values in a column not sharing a common symbol are significantly different at P < 0.05. Percentages of each treatment compared to baseline values are in parenthesis above the column.