Fig 4.
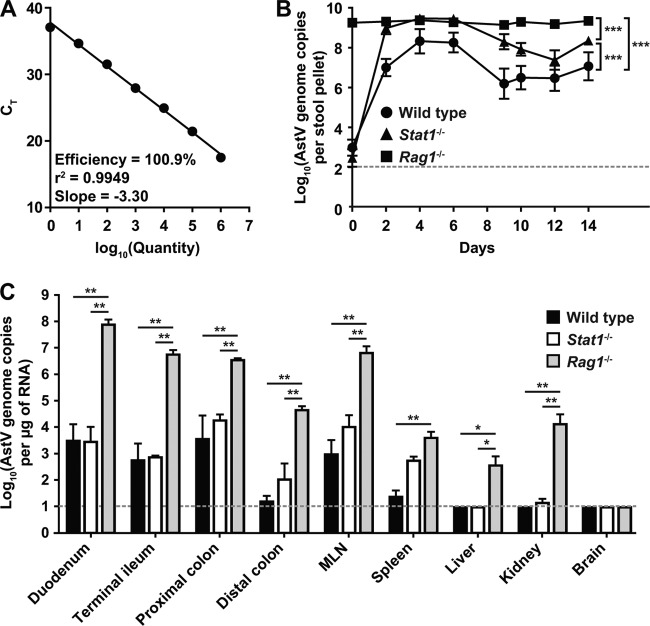
Adaptive and innate immune responses contribute to the control of MuAstV infection. (A) Standard curve of MuAstV STL qRT-PCR targeting a conserved region within the RdRP. Cycle threshold (CT) is plotted as a function of the quantity of input plasmid containing the target region. Data are means ± standard errors of the means determined for triplicate samples and are representative of the results of at least three experiments. (B and C) Wild-type, Stat1−/−, and Rag1−/− mice were cohoused for 14 days. (B) Stool samples were collected every 2 days and analyzed for MuAstV STL genome copy numbers by qRT-PCR. (C) At day 14, mice were sacrificed and the quantity of viral RNA in the indicated tissues was determined by qRT-PCR. Viral RNA levels shown represent means ± standard errors of the means determined for six mice pooled from two independent experiments. The dotted line indicates the limit of detection for the assay. Statistical significance was analyzed by two-way analysis of variance (ANOVA) with a Bonferroni posttest correction. *, P < 0.05; **, P < 0.001; ***, P < 0.0001.

