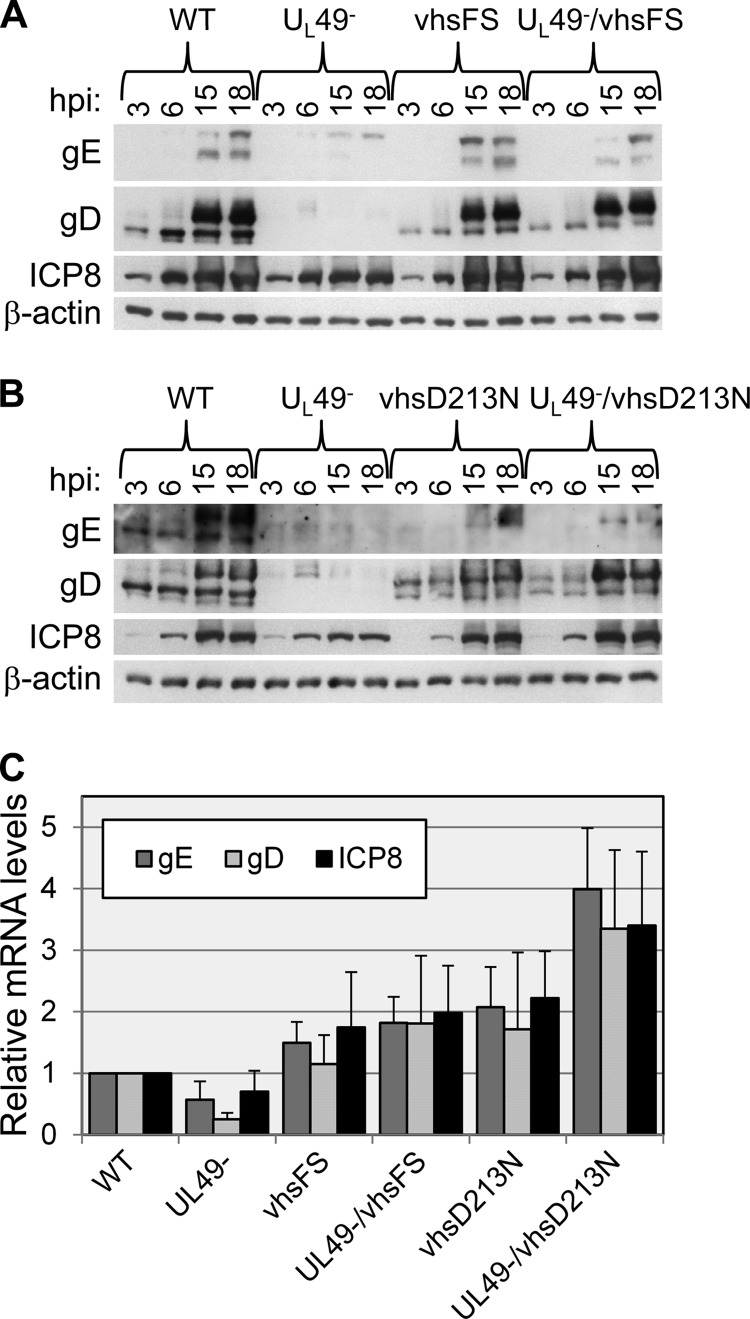
Fig 5.
Relative viral gene expression. (A and B) Vero cells were synchronously infected at an MOI of 10 PFU/cell with the WT, UL49−, vhsFS (A), UL49−/vhsFS (A), vhsD213N (B), or UL49−/vhsD213N (B) virus for the time periods shown. Lysates from infected cells were analyzed for steady-state protein levels by immunoblotting using antibodies specific to gE, gD, and ICP8. An antibody specific to β-actin was used as a loading control. (C) Vero cells were synchronously infected at an MOI of 10 PFU/cell with the WT, UL49−, vhsFS, UL49−/vhsFS, vhsD213N, or UL49−/vhsD213N virus for 18 h. Total RNA was purified, reverse transcribed, and used as a template for qRT-PCR with primers specific to gE, gD, and ICP8 mRNAs. Separate reactions were performed using primers specific to 18S rRNA as a control to normalize for template input. Transcript abundance, relative to that for the WT, was determined using the 2−ΔΔCT method. Data are expressed as the means ± standard errors of the means of three independent experiments, each performed in triplicate.

