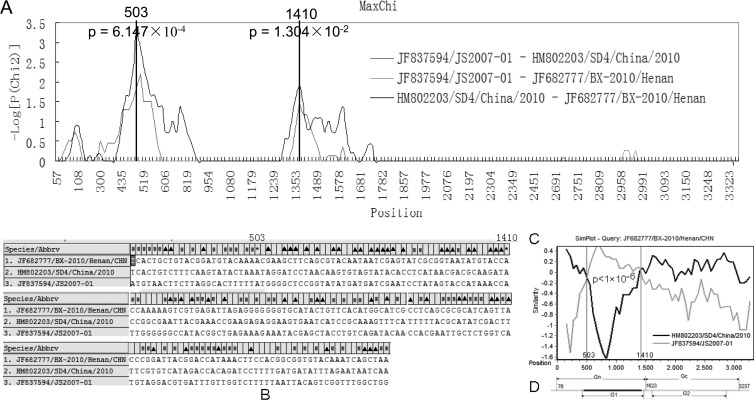
Fig 3.
(A) The analysis of putative breakpoints in the M segment employing the MaxChi method. The vertical lines represent the putative recombination breakpoints. P values of recombination analysis are shown near the breakpoints. (B) Alignment of M segment variable sites of HQ642767/BX-2010/Henan/CHN and its parent lineage representatives (JF837594/JS2007-01 and HM802203/SD4/China/2010). The recombinant variable sites identical to JF837594/JS2007-01 and HM802203/SD4/China/2010 are, respectively, indicated with ▲ and ■. The putative breakpoints are indicated with an asterisk. (C) Comparison of the segment M variable sites between HQ642767/BX-2010/Henan/CHN and each of its parent lineage representatives. The y axis gives the percentage of identity between the recombinant and putative parents. The x axis represents the nucleotide position of the M segment. Fisher's exact test was employed to test the different significance of these variable sites. The P value is shown between the two putative breakpoints. (D) A schematic representation of the recombinant M segment. The regions encoding Gn/G1 and Gs/G2 are shown. The recombination region is marked in black.

