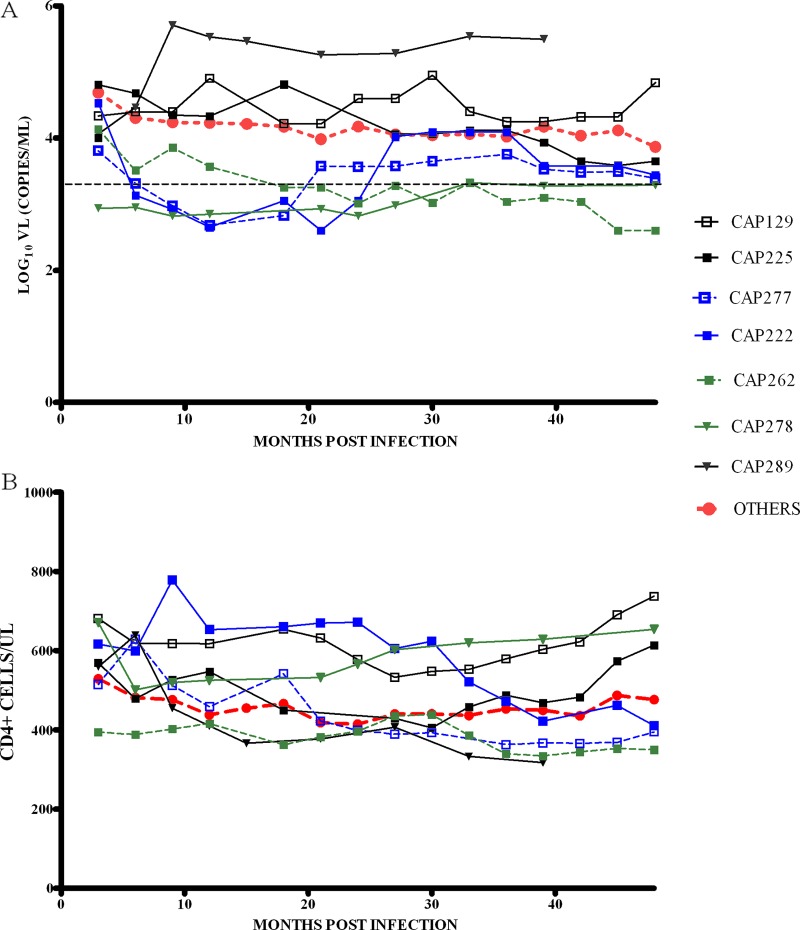
Fig 1.
(A) Viral load and (B) CD4+ T-cell count trajectories for the first 48 months of infection for five HLA-B*81:01-positive participants (CAP129, CAP222, CAP225, CAP262 and CAP277; represented by squares) and two B*39:10-positive participants (CAP278 and CAP289; represented by triangles). CAP289 had not reached 48 months postinfection by the time of this study. The trajectory of median viral loads and median CD4+ T-cell counts for all other CAPRISA participants (OTHERS), excluding B*39:10/81:01 and B*57/58:01, are shown as dotted red lines. The broken black line represents the viral load level of 2,000 copies/ml, defining controllers. Viral loads and CD4+ T-cell counts were smoothed at each time point (medians of measurements taken at three time points closest to intervals 3, 6, 9, 12, 15, etc., up to 48 months postinfection).

