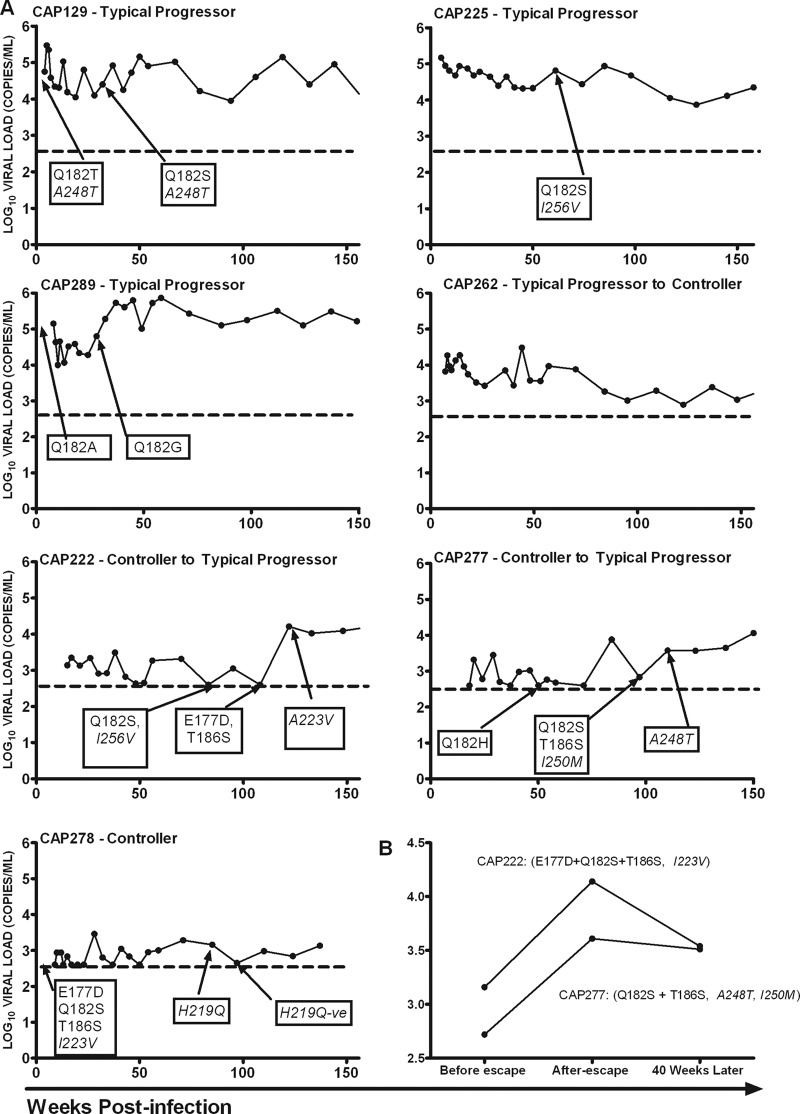
Fig 3.
(A) Viral load trajectories in the first 156 weeks (36 months) postinfection in B*81:01-positive (CAP129, CAP225, CAP222, CAP262, and CAP277) and B*39:10-positive (CAP278 and CAP289) participants, illustrating the timing of TL9-associated escape. The broken black line illustrates the limit of detection of the assay (400 copies/ml or 2.6 log10). Putative compensatory mutations are shown in italics. (B) Cost of multiple sequence evolution in or flanking the TL9 epitope in individuals who were controlling the infection, as measured by the change in viral load and longer follow-up showing the reduction in the maximum viral load but to levels higher than before escape. Four values of log10 viral loads over 9 months were used to calculate the median viral load before multiple residue escapes, after, and 40 weeks later. Putative compensatory mutations are shown in italics.

