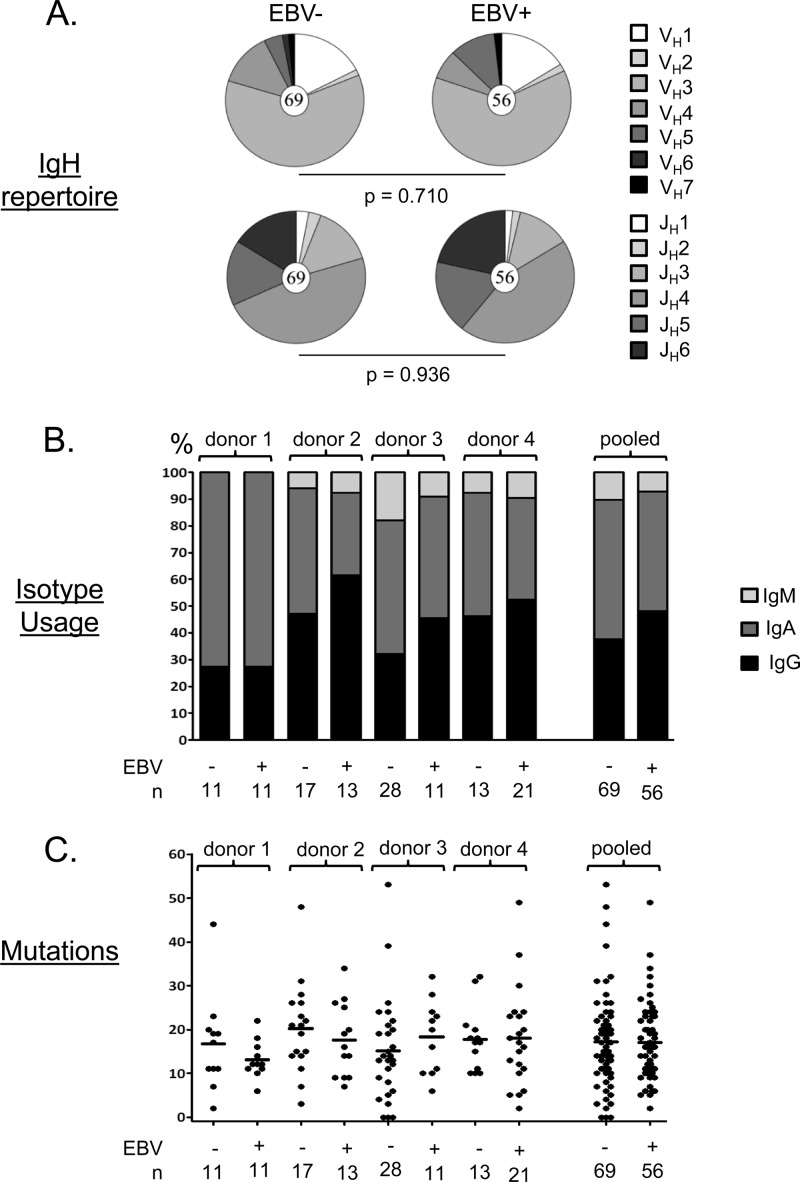
Fig 2.
Summary of the properties of the cloned antibodies. (A) Each pie chart shows the distribution of VH and JH gene usage for all the cloned antibodies tested. The total number of sequences analyzed is shown in the center circle. No significant differences were seen, although the frequency of JH6 was consistently higher in the EBV+ population. (B) Isotype usage for all of the cloned antibodies tested by donor. Note that the population studied is CD19+ IgD− memory B cells and therefore excludes IgM+ IgD+ memory cells, which we have shown previously to lack EBV (15). (C) Absolute numbers of somatic mutations in individual IgH genes from all four donors. Each dot represents an independent antibody. Horizontal lines indicate averages. Note that unlike our previous cohort (28), we did not see a significant difference in the number of mutations between antibodies derived from EBV+ and EBV− memory cells in this smaller cohort.

