Fig 3.
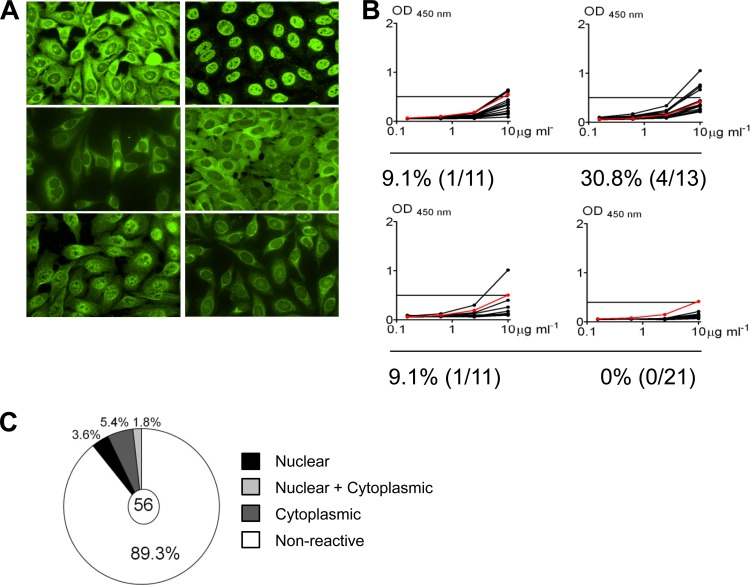
Self-reactivity of antibodies derived from EBV+ memory B cells. (A) Representative IFA staining patterns on HEp-2 cells. (B) ELISA for binding to HEp-2 cell lysates. Each black line represents an independent antibody. Horizontal lines indicate cutoff (optical density [OD] at 450 nm) for positive reactivity determined by comparison with low-polyreactivity positive-control antibody eiJB40 (red line). (C) Pie chart showing the fraction of antibodies positive by both IFA and ELISA and the breakdown of their staining patterns.

