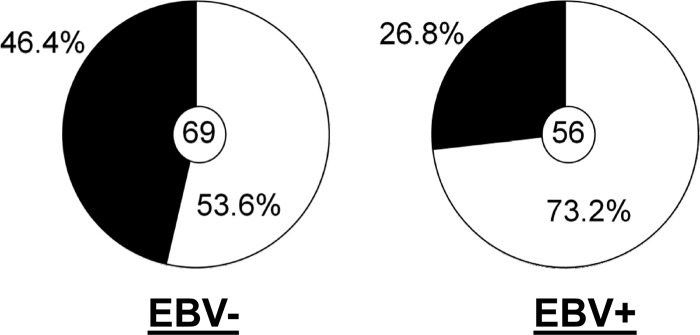
Fig 7.
Summary of the frequencies of polyreactive antibodies for all EBV+ and EBV− memory B cells. The pie charts summarize the frequencies of polyreactivity for all of the antibodies tested from Fig. 4 and 6 (P = 0.027). The value in each center circle is the total number of independent antibodies analyzed.

