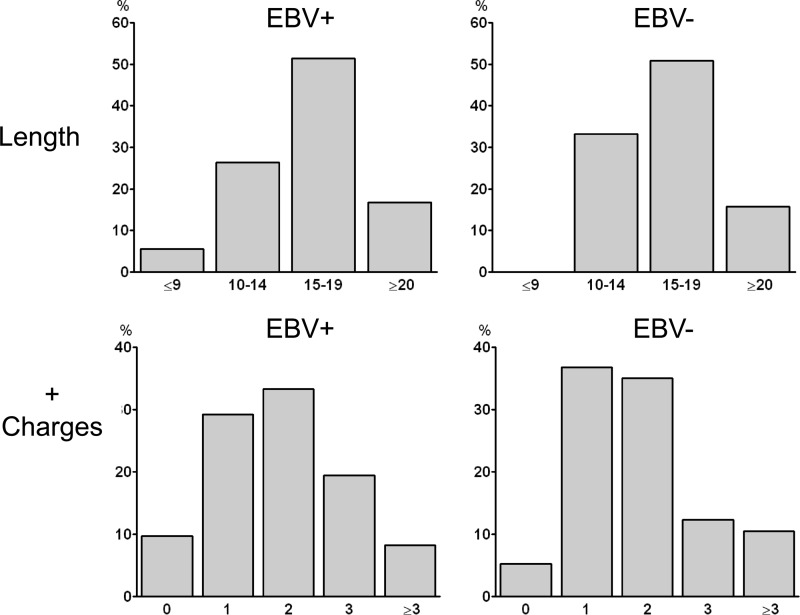
Fig 8.
Analysis of CDR3 regions for evidence of self-reactivity. (Top) Comparison of CDR3 lengths. The averages were 16.0 for the EBV+ population and 16.4 for the EBV− population (P = 0.54). (Bottom) Measurement of the number of positively charged amino acids in the CDR3s. The distributions were not significantly different (P = 0.63).

