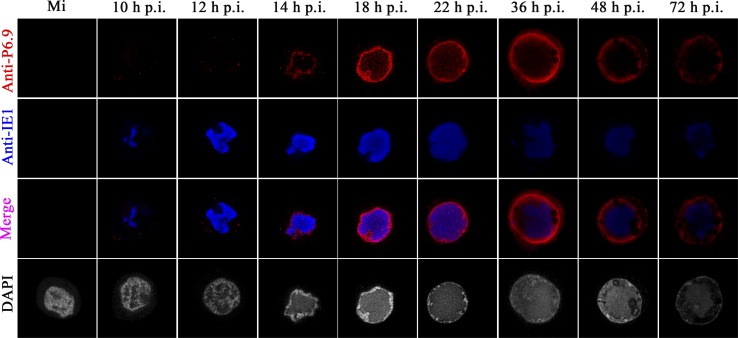
Fig 5.
Spatial-temporal distribution of P6.9 in the vAcWT-infected Sf9 cells. Sf9 cells were mock infected (Mi) or infected with vAcWT virus at an MOI of 10 TCID50/cell. At different h p.i., cells were incubated with rabbit anti-P6.9 antibodies and mouse anti-IE1 antibody as the primary antibodies. The goat anti-rabbit IgG conjugated with Alexa Fluor 647 antibody (Red) and the goat anti-mouse IgG conjugated with Alexa Fluor 561 antibody (pseudocolored blue) were used as secondary antibodies. Infected cells were stained with DAPI to directly visualize the nuclear DNA (pseudocolored gray).

