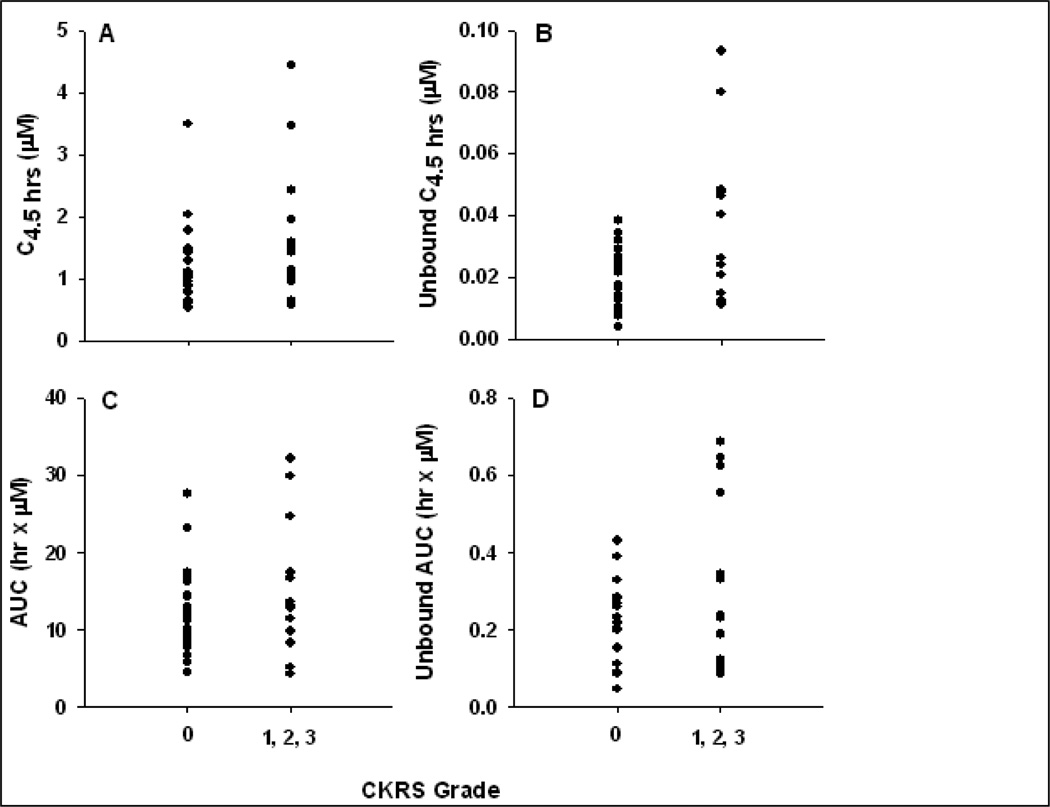
Figure 3.
Cytokine release vs. total and unbound flavopiridol. The relationship between cytokine release syndrome (CKRS) severity and total (A) or unbound (B) plasma flavopiridol at the end of the 4-hour infusion (C4.5hr) is displayed. Similar plots are displayed for AUC0–∞ calculated from total (C) or unbound (D) flavopiridol concentrations

