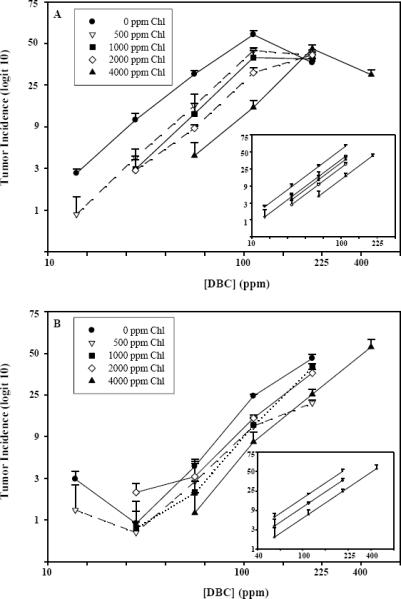
Figure 1.

DBC-initiated liver and stomach tumor response as a function of Chl dose. Rainbow trout were treated by dietary exposure for 4 weeks. Diets contained 14, 28, 56, 112, 224 or 448 ppm DBC and 0, 500, 1000, 2000 or 4000 ppm Chl. Trout were examined for tumor formation 9 months after DBC exposure ceased. Panel A shows the un-modeled liver tumor data as observed means (± SE), and the inset shows the modeled liver tumor dose-response curves without the highest DBC dose for each Chl curve. Panel B shows the un-modeled stomach tumor data as observed means (± SE), and the inset shows modeled stomach tumor dose-response curves for 0, 2000 and 4000 ppm Chl without data from the two lowest DBC doses. SE calculated for each data point prior to transformation to logit-scale. Lower error bars have been omitted due to distortion at lower end of logit scale and crowding of data points at higher incidence levels.
