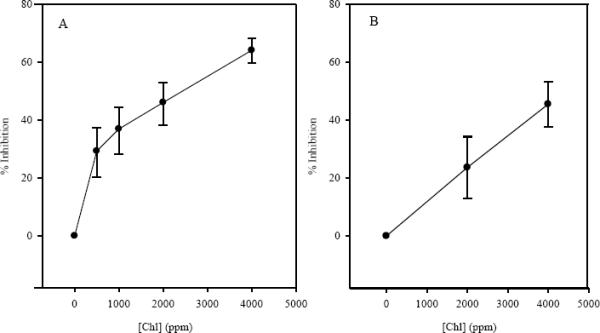
Figure 2.

Percent inhibition of final tumor incidence in liver (panel A) and stomach (panel B) at varying concentrations of dietary Chl. Percent inhibition was calculated for each Chl dose based on its alteration in the DBC TD25 value (see text). Liver tumor inhibition values were determined as described in the results section. Diets contained 14, 28, 56, 112, 224 or 448 ppm DBC and 500, 1000, 2000, or 4000 ppm Chl. Error bars represent 95% confidence intervals.
