
Figure 5.
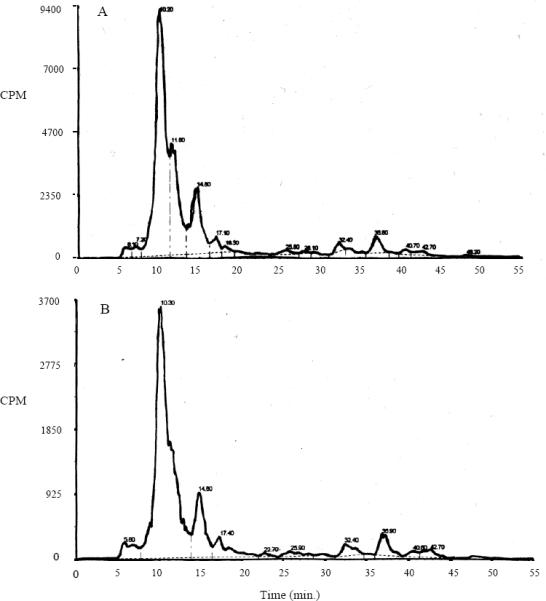
Chromatograms of in vivo DBC-DNA adducts from rainbow trout after 33P post-labeling and HPLC analysis. Liver adduct profiles were generated by 2-week exposure to either 112 ppm DBC alone (A) or 112 ppm DBC and 2000 ppm Chl (B). Note the same profile with and without Chl. The reduction is shown by the difference in the y-axis scales.