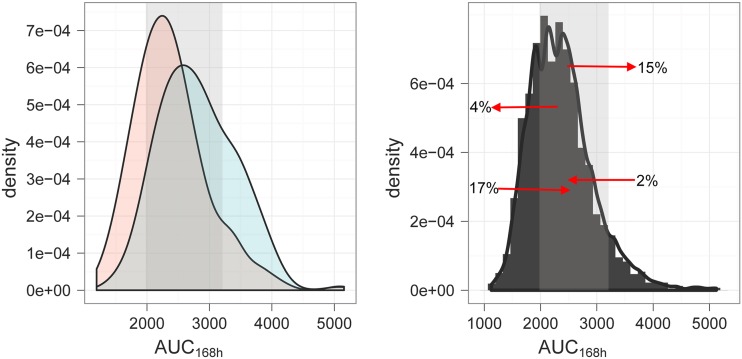
Fig 3.
(Left) Predicted AUC0–168 (mg · h/liter) distribution after a fixed dose of 1,500 mg PZA (blue) compared to that of the currently recommended weight-banded regimen (pink), including rounding to a whole-tablet dose (500 mg). The data illustrate pharmacokinetics in African TB patients. (Right) Overview of the changes in AUC0–168 following the administration of a fixed-dose regimen. The arrows indicate the direction of changes in individual exposure relative to the target range (shaded area) and the proportion (%) of patients affected by the administration of a fixed dose of 1,500 mg. The shaded area represents the target exposure range (i.e., between the 25th and 90th percentiles).

