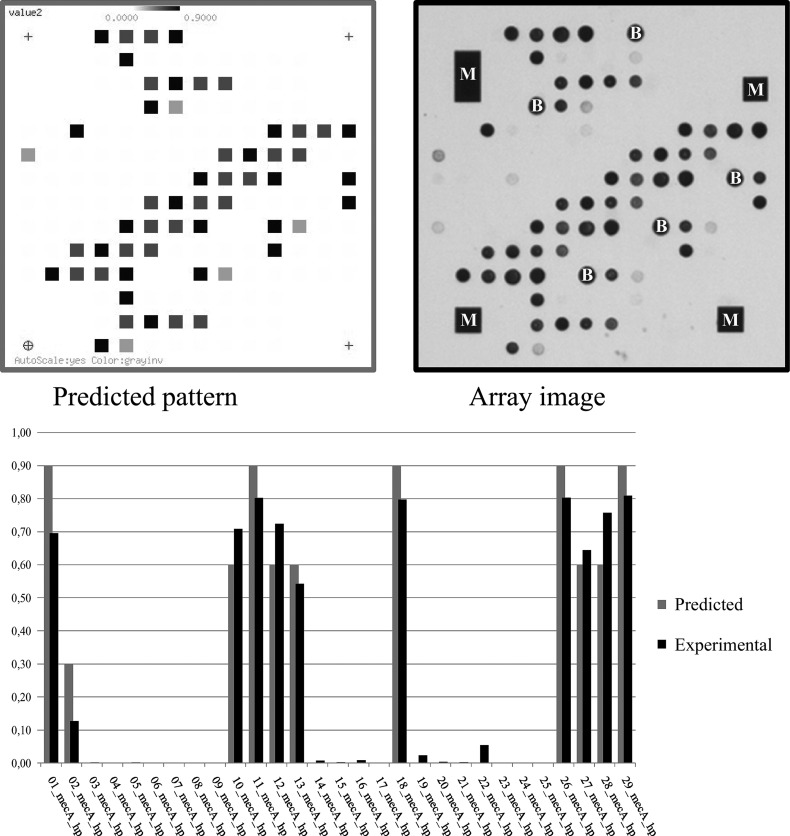
Fig 2.
Predicted and actual array image for S. aureus strain COL (GenBank accession no. CP000046.1, pattern [AB546266]/[CP000046]) and bar graph diagram of predicted and experimental spot intensities for the different probes. M, asymmetric metallic markers that provide orientation to the image analysis software; B, biotin spots serving as controls for the staining procedure.

