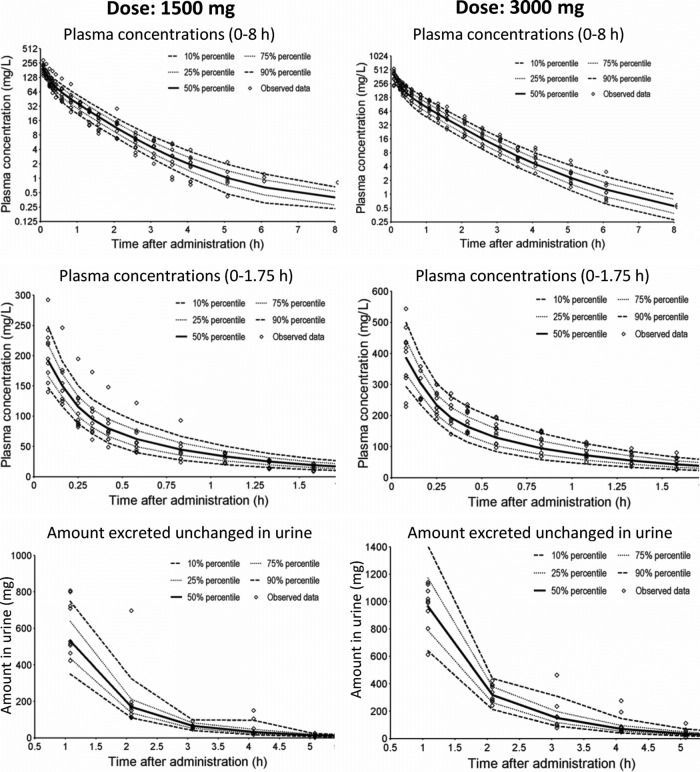
Fig 4.
Visual predictive checks for plasma drug concentrations and amounts of drug excreted unchanged in urine for model 3 (see Table 2). The plots show the observed data and the 80% prediction interval (i.e., between the 10th to 90th percentiles) and the interquartile range (i.e., between the 25th and 75th percentiles) from 4,000 simulated subjects. Ideally, 50% of the observed data points should fall inside the interquartile range at each time point, and 80% of the observed data should fall inside the 80% prediction interval.

