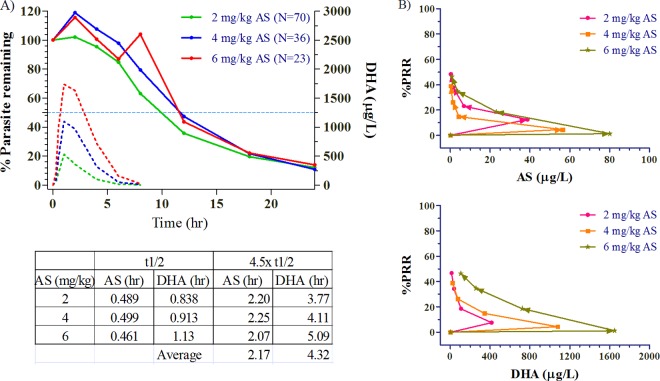
Fig 4.
(A) Parasite clearance as the mean percentage of baseline values over the first 24 h for the 3 dose groups. The broken lines show the median concentration-time profiles of AS and DHA. The geometric mean half-life (t1/2) and 4.5× half-life values appear in the accompanying table below the graph. (B) Concentration-effect relationships on percent parasite reduction (percent parasite reduction ratio [%PRR]) for AS and DHA at the 3 dose levels.

