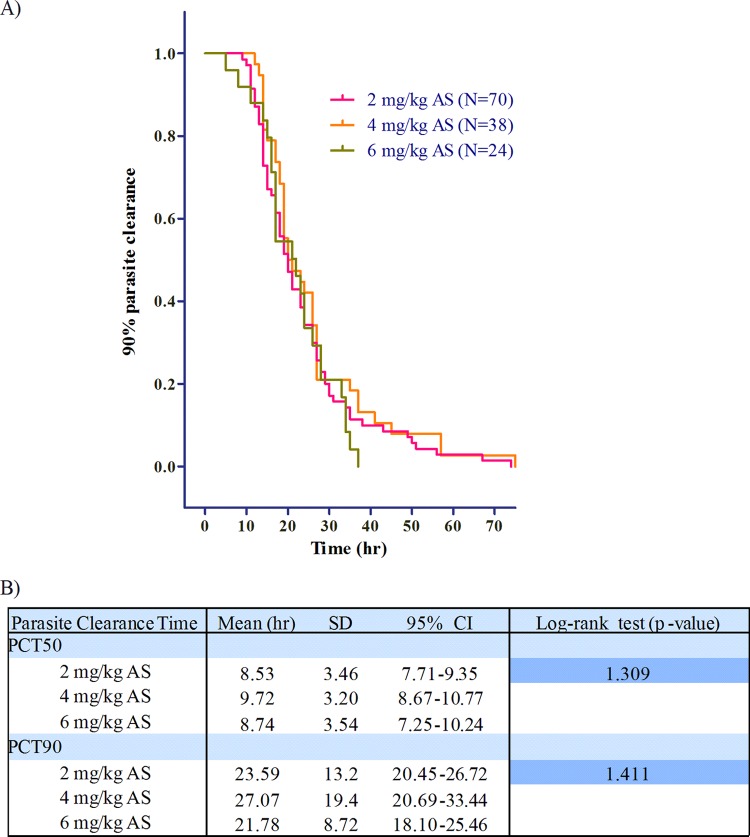
Fig 5.
(A) Kaplan-Meier survival analysis of time to 90% parasite clearance. The x axis represents the time to reach 90% parasite clearance. (B) Mean times to 50% or 90% parasite clearance (PCT50 or PCT90) by the log rank test at the 3 doses of artesunate. The mean, standard deviation (SD), and 95% confidence interval (95% CI) values are shown.

