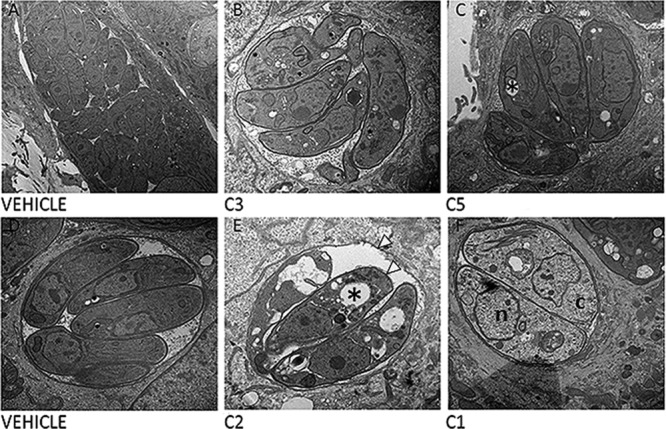
Fig 6.

Parasite ultrastructure after exposure to four inhibitory compounds. (A to C) Parasites were treated with either vehicle (A), C3 (B), or C5 (C) for 40 h. (B) C3-treated parasites have a phenotype most similar to the phenotype of parasites treated with the vehicle control, with the exception of growth arrest over the 40-h incubation period. (C) C5-treated parasites have empty (*) vacuoles compared to parasites treated with vehicle. (D to F) In contrast to treatment with C1 and C3, treatment with C2 (E) and C1 (F) showed dramatic effects on parasite morphology compared to treatment with vehicle (D) over a 24-h period. C2-treated parasites have empty vacuoles within them (*) and a ruffled PVM and parasite plasma membrane (white arrowheads), while C1-treated parasites have reduced electron density both in the nucleus (n) and in the cytoplasm (c). Magnifications, ×12,000 (A), ×20,000 (B and D to F), and ×25,000 (C).
