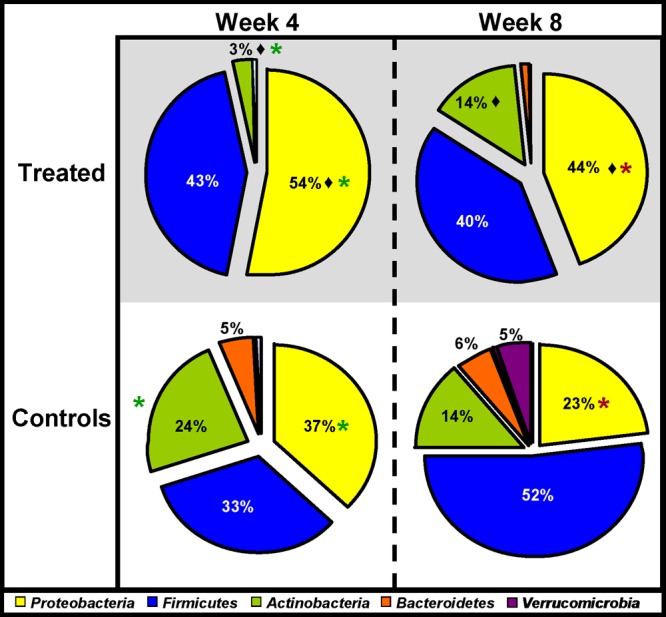
Fig 1.

Microbial distributions at the phylum level in the samples from treated and control infants at week 4 and week 8. Statistically significant differences between treated infants and controls at week 4 are indicated by asterisks (P < 0.05). Statistically significant differences between treated infants and controls at week 8 are indicated by asterisks. A statistically significant difference between treated infants at week 4 and week 8 (i.e., the recovery of the treated infants) is indicated by a diamond. Percentages are based on proportions of assignable tags.
