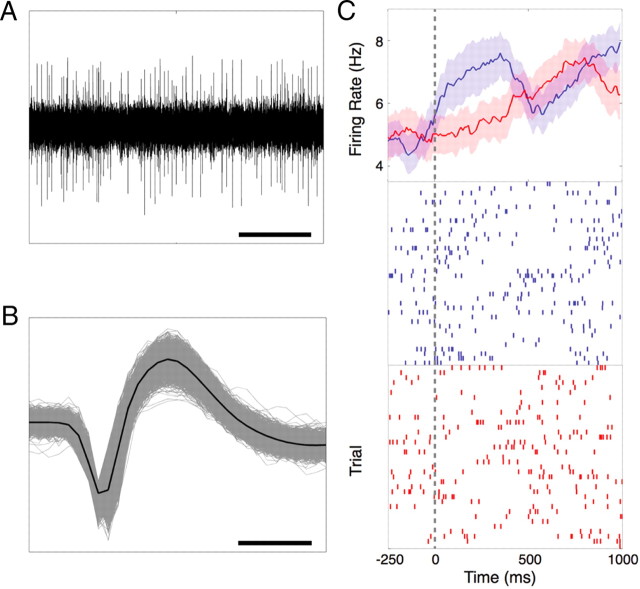
Figure 2.
A, Example of a raw analog voltage trace from one recording session. Scale bar, 0.5 s. B, Example of waveform from one isolated neuron. Scale bar, 0.5 ms. C, Single-neuron example of nucleus accumbens activity predicting wager at the go-cue. Continuous firing rate histogram (top) and raster plots (middle and bottom) of all trials in which the subject bet high (blue) or low (red) relative to the go-cue (gray dashed line). For each plot, the y-axis represents trial number while the x-axis represents time. Each hatch mark represents a single action potential.

