Figure 1.
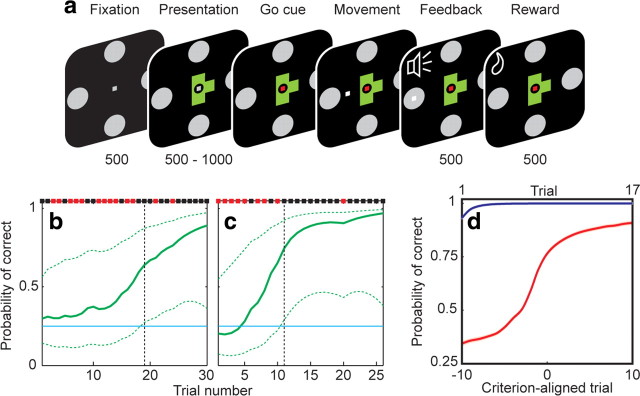
Behavioral task and performance. a, The sequence of task epochs and their duration in milliseconds is shown for each representative screen. A fixation spot and the four targets appeared for 500 ms, followed by presentation of an object. After a variable delay, the go cue was indicated by a color change in the fixation spot, allowing joystick movement. Once the target was reached and held for 50 ms, a high or low tone indicated correct or incorrect response, respectively, and correct responses were rewarded with a drop of water. Fixation within a 1° window was required until target acquisition. b, c, Behavior during example learning blocks. Binary results (black, correct; red, incorrect) are shown along the top. The estimated learning curve is shown in green, with 99% confidence intervals indicated by the dashed lines. The criterion trial (vertical black dashed line) was defined as the point at which the lower 99% confidence interval surpassed chance (25%, horizontal blue line). These two learning blocks are the same as those depicted in Figure 5, a and c. d, Population performance during familiar object (blue) and novel object (red) trials over learning, averaged across all learning blocks. Novel object trials are aligned to the criterion trial (lower x-axis labels) to allow for comparison across blocks regardless of learning rate. Familiar object trials are ordinally numbered (upper x-axis labels), as a criterion learning trial does not apply. Performance indicated mastery of familiar objects, and a gradually improving learning curve for novel objects. SEs are indicated by shading but are too small to be visible.

