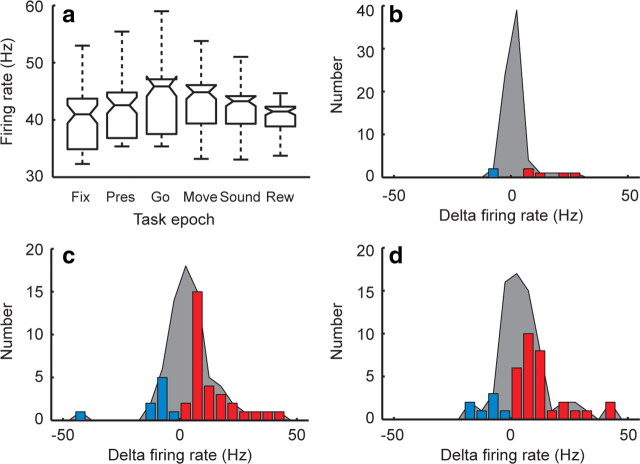
Figure 3.
Population task responsiveness. a, Box plot of population firing rates across the six task epochs: fixation (Fix), presentation (Pres), go cue (Go), movement (Move), feedback sound (Sound), and reward (Rew). The central line in each box represents the median, the box edges the 25% and 75% quartiles, and the whiskers 2.7 SDs (representing ∼99.3% of the data). b–d, Distribution of changes in firing rate (with respect to fixation) at the presentation, go cue, and movement epochs, respectively. The shaded region represents any change in firing rate relative to fixation, and the colored bars represent statistically significant increases (red) or decreases (blue).

